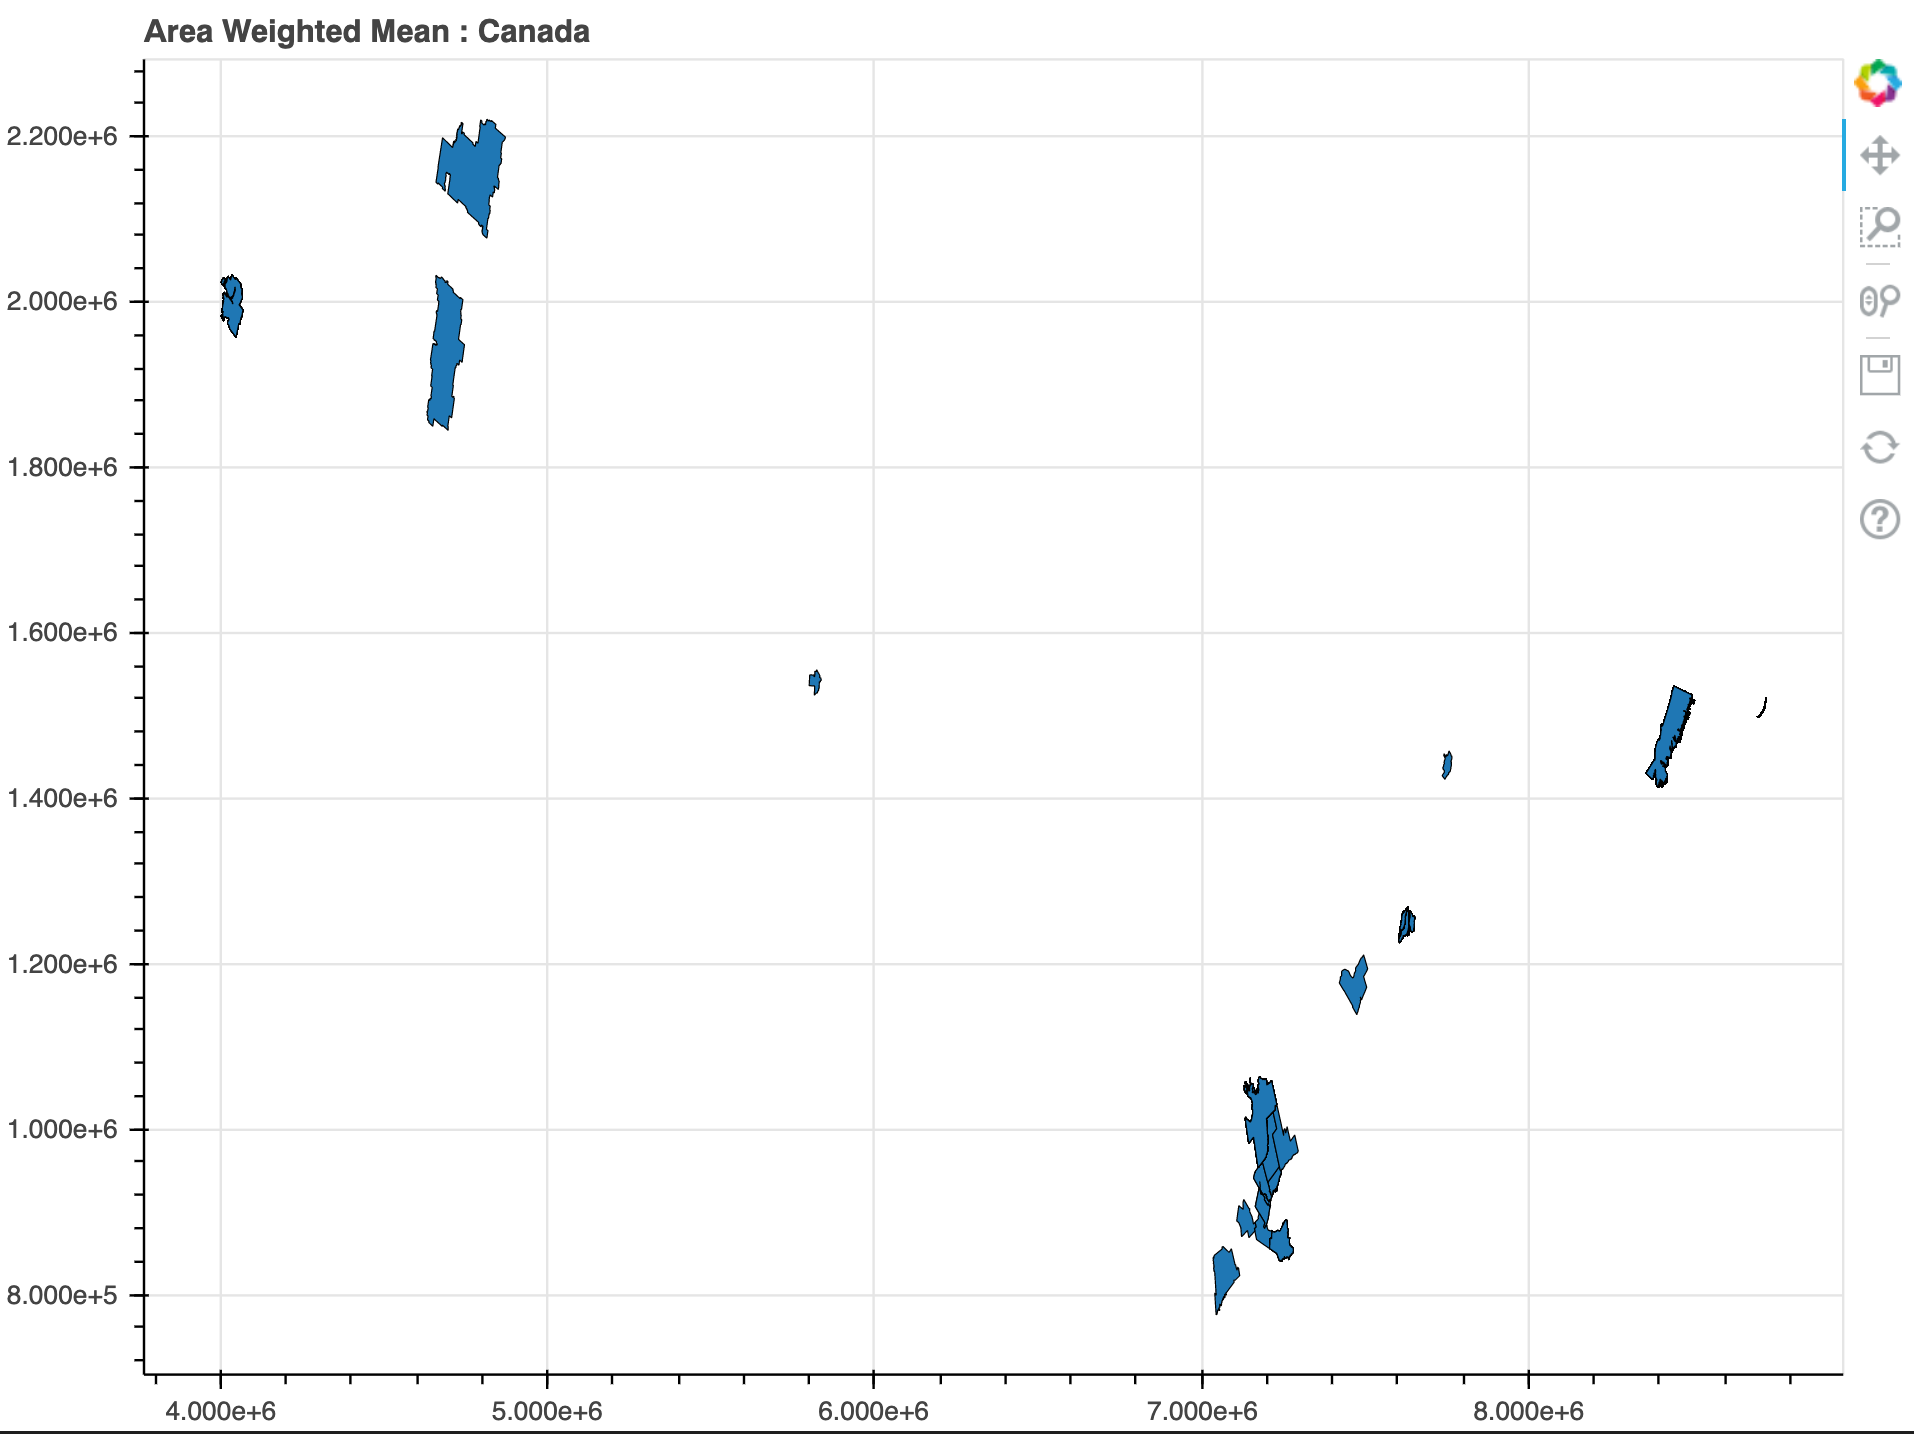
I’ve been having lots of success geoplotting points with Bokeh, but have now run into an issue trying to plot polygons and multi polygons where even the most basic plot times out (having left it for hours now). It’s my first time using GeoJSONDataSource and I think it’s time I asked for help. I carefully plotted a GeoPandas DataFrame of the below format. I’d upload the geojson because all the data was publicly available but it’s outputting a 162.8 MB file which I’m thinking might be the problem? Or do I have to treat the multi-polygons and polygons differently? The polygons are Canadian electoral districts.
type(data_CAN)
geopandas.geodataframe.GeoDataFrame

data_CAN.shape
(293, 3)

	POP	    Bool	geometry
0	2731571	True	MULTIPOLYGON (((7239903.869 950427.517, 723992...
1	2463431	True	MULTIPOLYGON (((4042996.157 2027876.066, 40452...
2	1942044	True	MULTIPOLYGON (((7632208.177 1268333.720, 76321...
3	1498778	True	POLYGON ((4660000.566 2031508.140, 4661063.386...
4	1381739	True	MULTIPOLYGON (((7194207.560 947086.957, 719435...
Following a couple good examples online, I’m wondering why the code block hangs and won’t display in the notebook. I’m using Bokeh 2.0.2 with Python 3.8.2 in an VSCode workspace with an up to date Jupyter client and core installed.
This completes:
# Create Bokeh Data Structure
sourceG = GeoJSONDataSource(geojson = data_CAN.to_json())
But then hangs here:
output_notebook()

plot = figure(
    title="Area Weighted Mean : Canada",
    plot_height = 600,
    plot_width = 800
    )

plot.patches(
    "xs",
    "ys",
    source = sourceG,
    line_color = "black",
    line_width = 0.1
    )

show(plot)