Sorry for lack of information. In the process of reducing my code to a minimal reproducible example…I discovered the problem. It’s almost as if creating a minimal reproducible example not only benefits those trying to help, but is also is a good way to debug things in the first place and may prevent the forum from getting spammed 
In case future users stumble upon this post with similar difficulties, the problem was that my x-values were a list of numeric strings instead of a list of actual numbers.
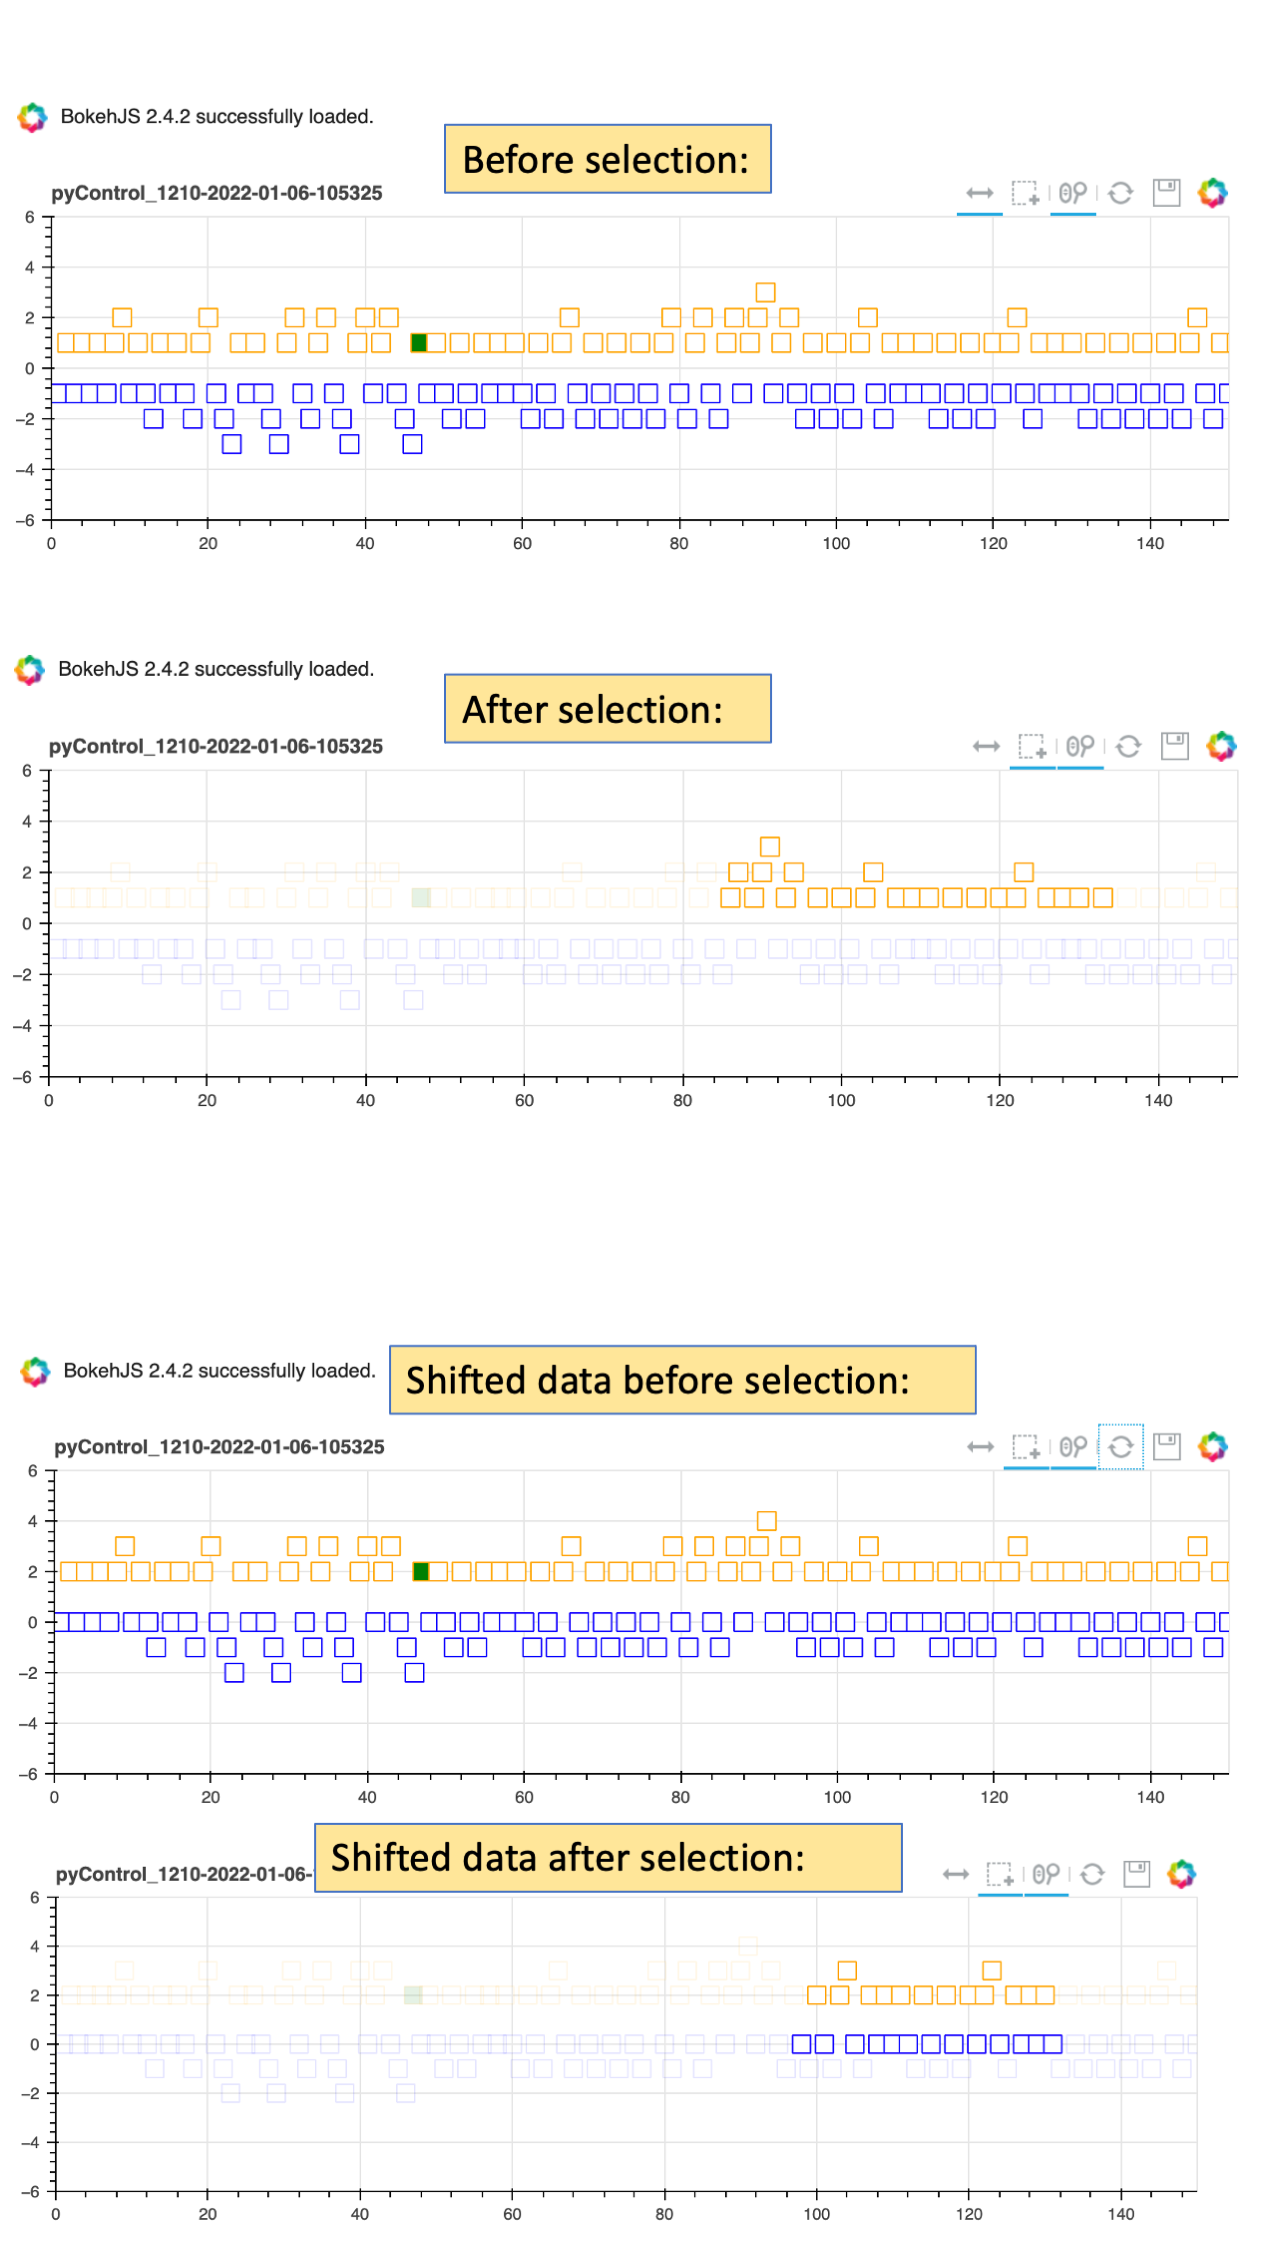
Here is a .gif showing the resulting problem of negative numbers not being selected in the first plot. The second plot shows the expected behavior that happens when properly using numbers for the x-values.
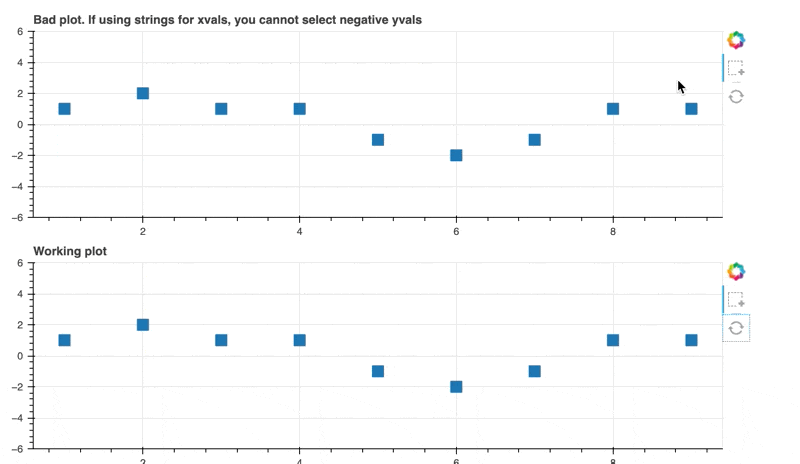
Below is the code that demonstrates the problem and the solution (shown in the video). I am using Bokeh 2.4.2 with Python 3.10.0
import bokeh.plotting as bk
from bokeh.models import BoxSelectTool,ColumnDataSource
from bokeh.layouts import column

trial_strings = ['1','2','3','4','5','6','7','8','9']
trial_nums = [1,2,3,4,5,6,7,8,9]
vals =   [1,2,1,1,-1,-2,-1,1,1]

bad_source  = ColumnDataSource(
    data={'trials':trial_strings,
          'vals': vals }
)
good_source  = ColumnDataSource(
    data={'trials':trial_nums,
          'vals': vals }
)

bad_plot = bk.figure(
    width = 800,
    height = 250,
    tools = "reset",
    title = 'Bad plot. If using strings for xvals, you cannot select negative yvals',
    y_range = [-6,6],
)
good_plot = bk.figure(
    width = 800,
    height = 250,
    tools = "reset",
    title = 'Working plot',
    y_range = [-6,6],
)

bad_render = bad_plot.square('trials','vals',source=bad_source, size=12)
good_render = good_plot.square('trials','vals',source=good_source, size=12)

bad_plot.add_tools(BoxSelectTool(dimensions="width"))
good_plot.add_tools(BoxSelectTool(dimensions="width"))


bk.show(column(bad_plot,good_plot),sizing_mode="scale_both")
@Bryan thank you for your quick response and for creating such a wonderful tool!