I’m working on an application that displays a set of 5 lines that are based on a clustered average of 105 other lines.
In my legend, I have it labeling the 5 lines as “x of 105 passes” with x representing how many lines were clustered into that one line.
However, if multiple lines that are plotted happen to be clustered with the same number of lines, Bokeh will only render one label to the legend. Is there a workaround for this?
Note, it is possible to add a prefix tag like “L1: 86 of 105 pases … L2: 4 of 105 passes” but I’d like to know if there is a workaround for this without having to do that.
···
On Friday, September 28, 2018 at 12:08:21 PM UTC-4, Timothy Snyder wrote:
I’m working on an application that displays a set of 5 lines that are based on a clustered average of 105 other lines.
In my legend, I have it labeling the 5 lines as “x of 105 passes” with x representing how many lines were clustered into that one line.
However, if multiple lines that are plotted happen to be clustered with the same number of lines, Bokeh will only render one label to the legend. Is there a workaround for this?
It's fine for legends to have identical labels in general, but when using the convenience mechanism of passing "legend" to a glyph function, the assumption is that you want identical labels coalesced (e.g. drawing a line together with markers, you want both as part of the legend).
Thanks,
Bryan
···
On Sep 28, 2018, at 09:09, Timothy Snyder <[email protected]> wrote:
Note, it is possible to add a prefix tag like "L1: 86 of 105 pases ... L2: 4 of 105 passes" but I'd like to know if there is a workaround for this without having to do that.
On Friday, September 28, 2018 at 12:08:21 PM UTC-4, Timothy Snyder wrote:
I'm working on an application that displays a set of 5 lines that are based on a clustered average of 105 other lines.
In my legend, I have it labeling the 5 lines as "x of 105 passes" with x representing how many lines were clustered into that one line.
However, if multiple lines that are plotted happen to be clustered with the same number of lines, Bokeh will only render one label to the legend. Is there a workaround for this?
I would like the legend to look like this:
------------------------
86 of 105 passes
2 of 105 passes
14 of 105 passes
4 of 105 passes
4 of 105 passes
------------------------
However, it ends up like this:
------------------------
86 of 105 passes
2 of 105 passes
14 of 105 passes
4 of 105 passes
------------------------
Thanks for the response Bryan. I’ve since implemented this but I’ve run into another problem. I’m using a MultiLine to represent 5 lines on the plot. However, when I add the glyph to the plot, I’m returned one GlyphRenderer. As such, this renderer is all I have to supply to my LegendItems. Now, the appearance of each entry in the legend is based on the first line in my MultiLine
def build_legend_clean(renderer, pass_data):
legend = Legend(location="top_left")

num_clusters = pass_data.num_clusters

num_passes_by_cluster = pass_data.num_passes_by_cluster

total_passes = pass_data.total_passes

for i, (num_passes) in enumerate(num_passes_by_cluster):

    lbl = "{:.0%}".format(num_passes / total_passes)

    legend.items.append(LegendItem(label=lbl, renderers=[renderer]))

return legend
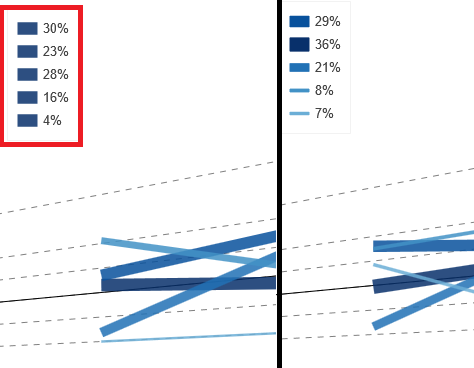
I’ve attached an image so you can better see what I’m stuck on. The legend highlighted in red is the problem one. The other legend is the desired result (achieved in a hacky way where I plotted the 5 lines individually and then made them invisible). Any insight would be helpful.
Ignore the percentages in the two legend samples. Concerned about the color and width of lines.
···
On Tue, Oct 9, 2018 at 10:24 AM Timothy Snyder [email protected] wrote:
Thanks for the response Bryan. I’ve since implemented this but I’ve run into another problem. I’m using a MultiLine to represent 5 lines on the plot. However, when I add the glyph to the plot, I’m returned one GlyphRenderer. As such, this renderer is all I have to supply to my LegendItems. Now, the appearance of each entry in the legend is based on the first line in my MultiLine
I’ve attached an image so you can better see what I’m stuck on. The legend highlighted in red is the problem one. The other legend is the desired result (achieved in a hacky way where I plotted the 5 lines individually and then made them invisible). Any insight would be helpful.
Ignore the percentages in the two legend samples. Concerned about the color and width of lines.
On Tue, Oct 9, 2018 at 10:24 AM Timothy Snyder <[email protected]> wrote:
Thanks for the response Bryan. I've since implemented this but I've run into another problem. I'm using a MultiLine to represent 5 lines on the plot. However, when I add the glyph to the plot, I'm returned one GlyphRenderer. As such, this renderer is all I have to supply to my LegendItems. Now, the appearance of each entry in the legend is based on the first line in my MultiLine
for i, (num_passes) in enumerate(num_passes_by_cluster):
lbl = "{:.0%}".format(num_passes / total_passes)
legend.items.append(LegendItem(label=lbl, renderers=[renderer]))
return legend
I've attached an image so you can better see what I'm stuck on. The legend highlighted in red is the problem one. The other legend is the desired result (achieved in a hacky way where I plotted the 5 lines individually and then made them invisible). Any insight would be helpful.