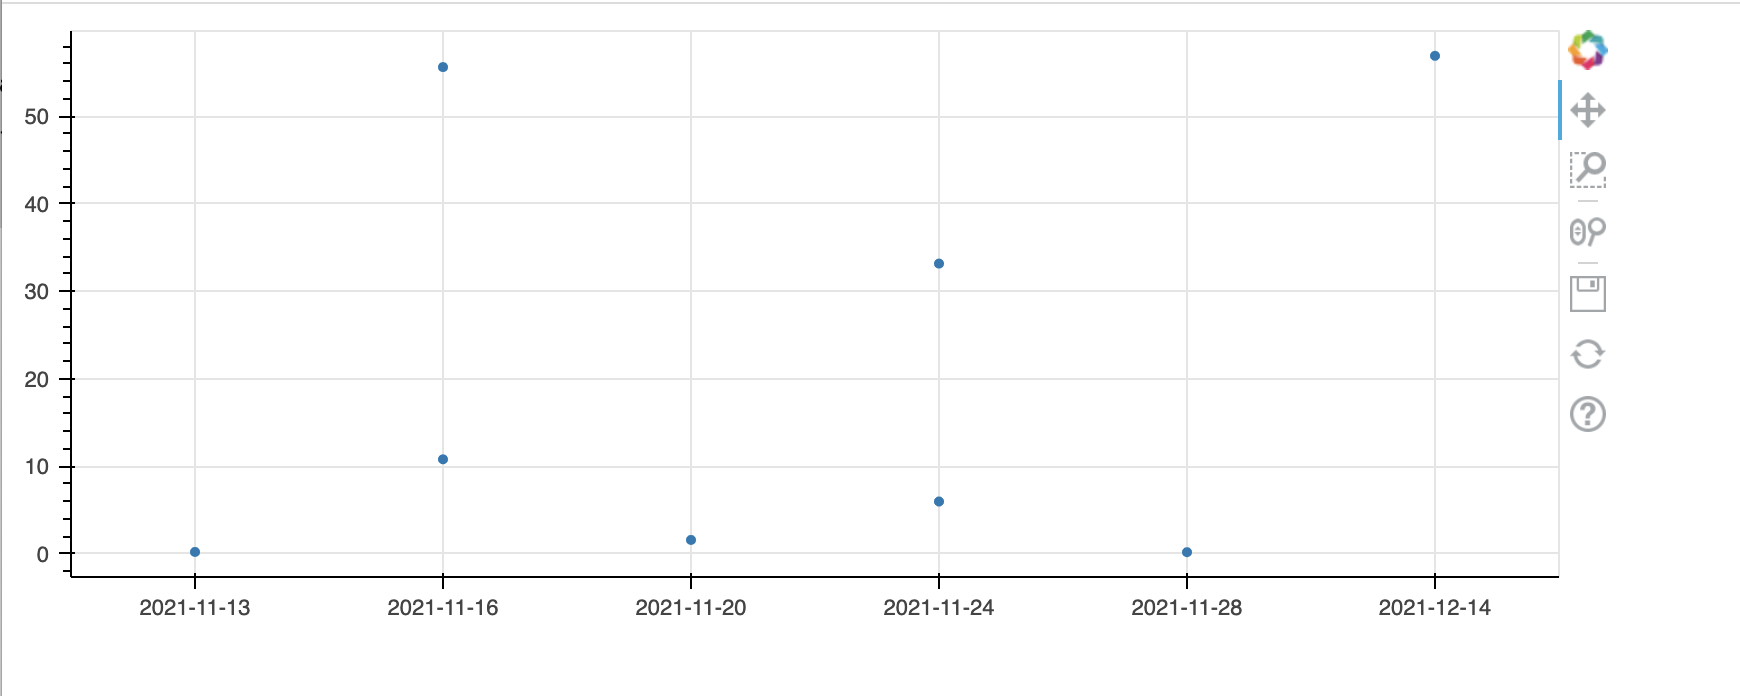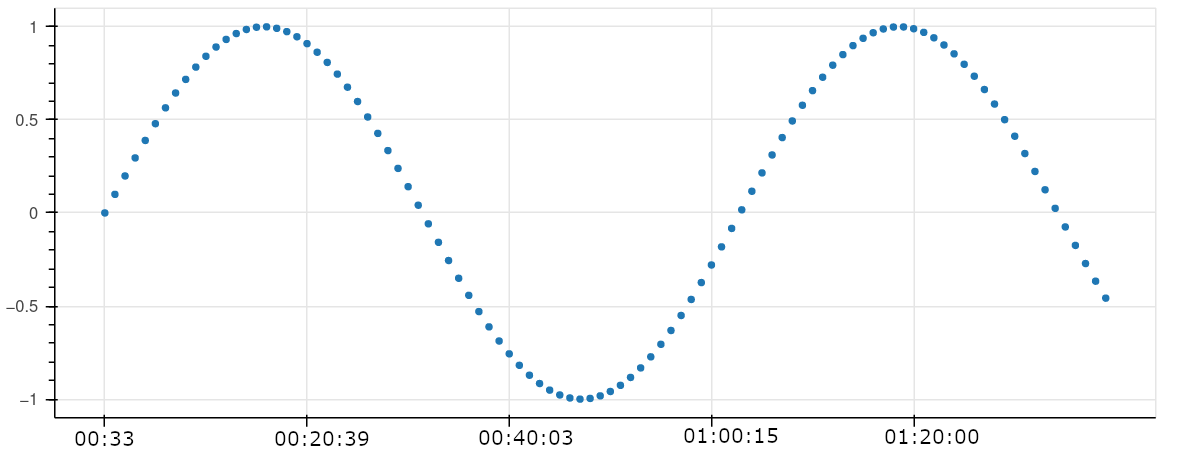
I have a simple graph with a linear numerical (non-categorical) x-axis. I would like to use tick labels, which are not true x-values, but come from a different column in the data source. Can I do that with bokeh?
So I have a dataset with three columns: x:float, y:float, x_label:datetime. I plot y(x), but need to show x_label as tick labels instead of x.
In fact, x represents the number of events and x_label is the actual time point at which the event occurred. However, events do not arrive uniformly in time, but I would like the x-axis to be linear with respect to event numbers (not time).