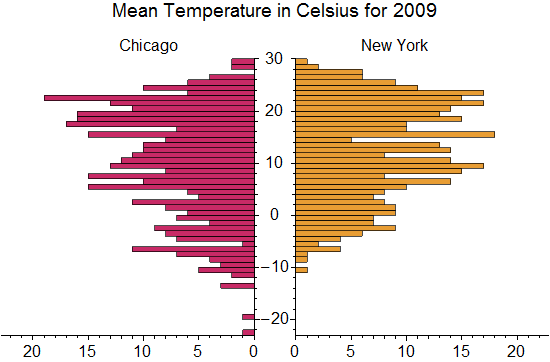
I am trying to improve on my paired histogram, to make it look more like https://www.wolfram.com/mathematica/new-in-8/statistical-visualization/HTMLImages.en/created-paired-histograms-for-comparing-data/O_3.png.
Haven’t completely got there yet, and this is what I have at the moment…
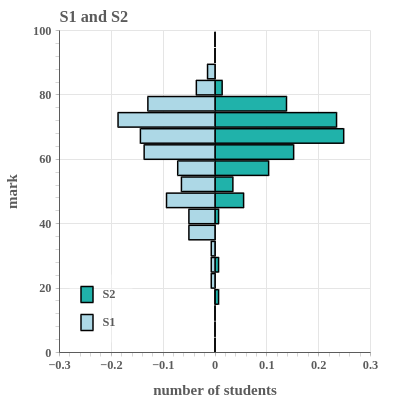
Any suggestion how to improve this? Especially with two linear axes over half the plot, or two equally sized plots with one set of numbers in the middle (and one axis from large to small). Any pointers welcome.