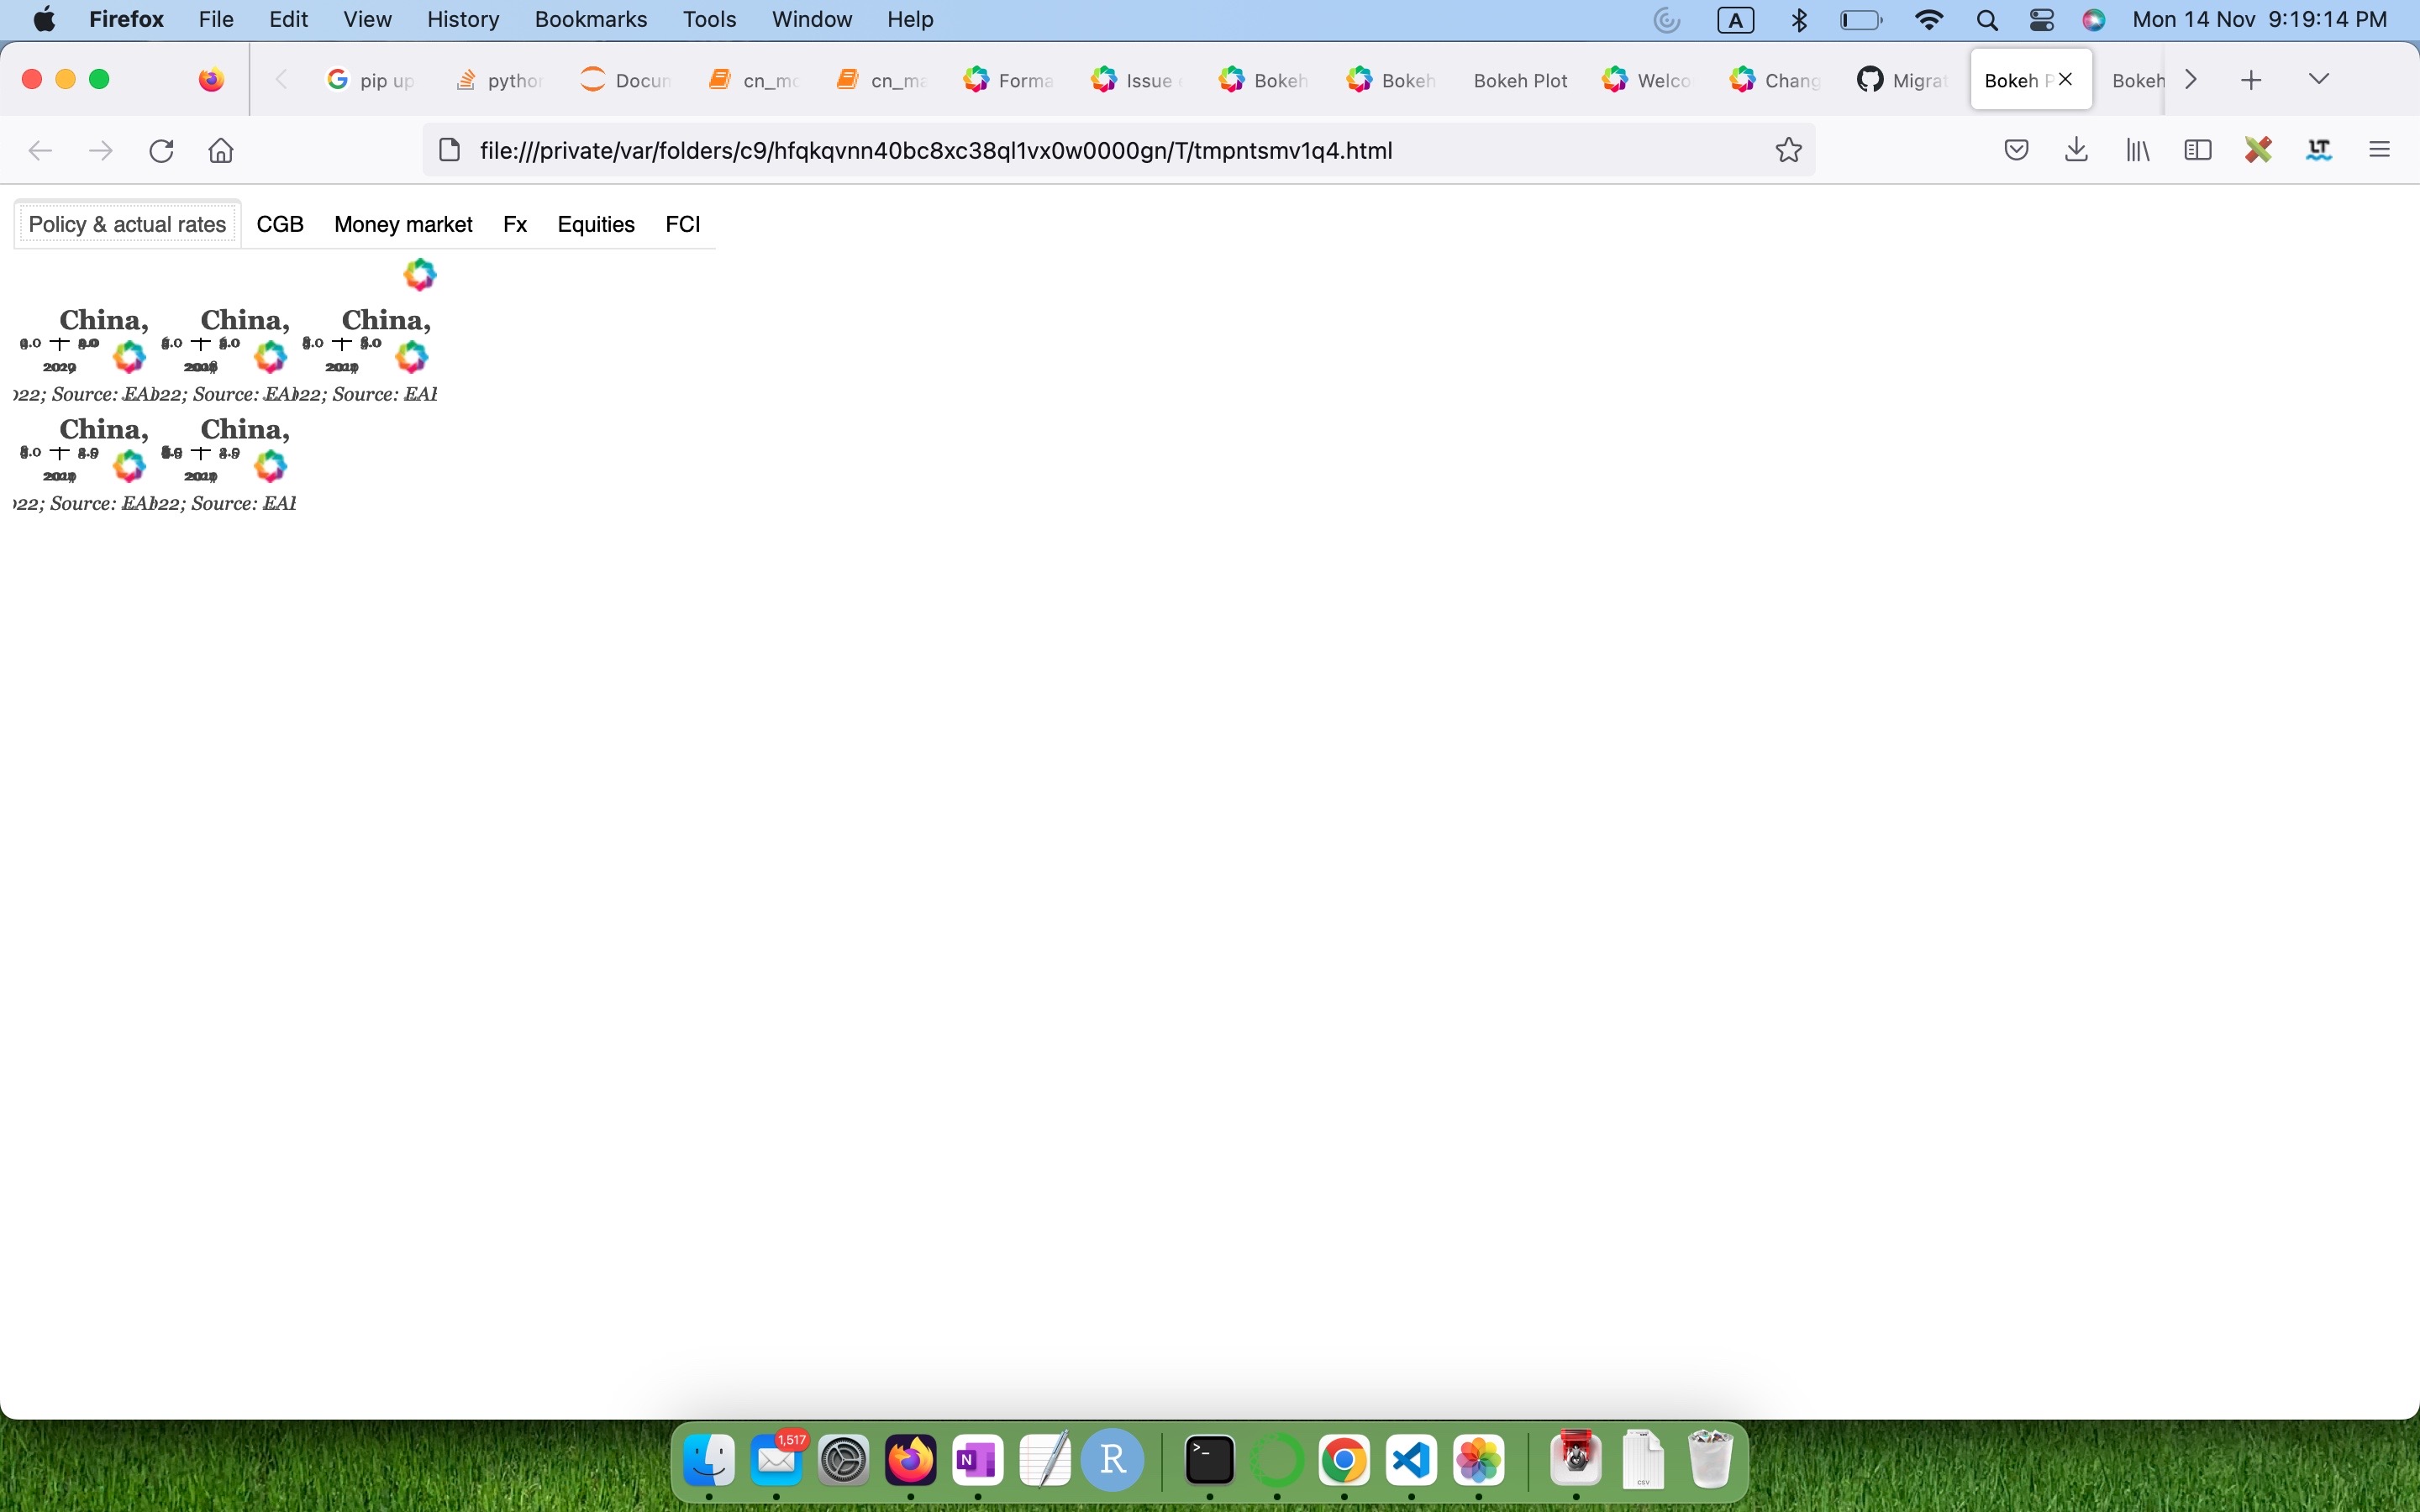
Hi, I have been using code like this to produce panels of charts.
charts_1 = gridplot([[ch_1, ch_2, ch_3], [ch_4, ch_5, ch_6]], sizing_mode='stretch_both', merge_tools=False)
charts_2 = gridplot([[ch_7, ch_8], [ch_9, ch_10]], sizing_mode='stretch_both', merge_tools=False)

tab1 = TabPanel(child=(layout(column(charts_1), sizing_mode='stretch_both')),title="tab1")
tab2 = TabPanel(child=(layout(column(charts_2), sizing_mode='stretch_both')),title="tab2")

tabs = Tabs(tabs=[ tab1, tab2])
Previously, the panels would fill the screen. But after upgrading to 3.0.1, the chart sizes have drastically shrunk, as the screenshot shows. Has something changed in the new version that would explain this? Thanks