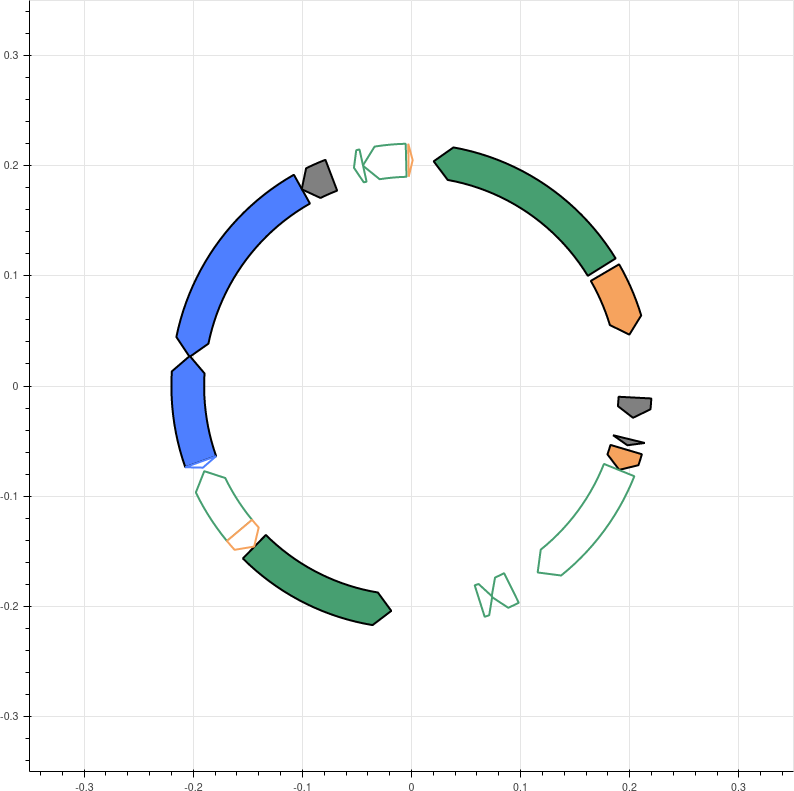
I am trying to plot patches using source, but I am running into issues. I have gotten this to work in (from what I can tell) almost identical ways, but I cannot for the life of me figure out what I am doing wrong here.
Here is a minimal example:
import pandas as pd
from bokeh.io import show
from bokeh.plotting import figure
from bokeh.models import HoverTool

url='https://raw.githubusercontent.com/mmcguffi/random_test_cases/master/test.csv'
df=pd.read_csv(url,index_col=0)
df['x'] = pd.eval(df['x']) #convert to list
df['y'] = pd.eval(df['y']) #convert to list

hover = HoverTool(names=["1"])
TOOLTIPS='<font size="3"><b>@Feature</b> — @Type</font> <br> @Description'
plotSize=.35
plotDimen=800
p = figure(plot_height=plotDimen,plot_width=plotDimen, title="", toolbar_location=None, match_aspect=True,sizing_mode='scale_width',
               tools=[hover,], tooltips=TOOLTIPS, x_range=(-plotSize, plotSize), y_range=(-plotSize, plotSize))

for index in df.index:
    p.patch(x='x', y='y', fill_color='fill_color',line_color='line_color',name="1",line_width=2, source=df.loc[[index]])
show(p)
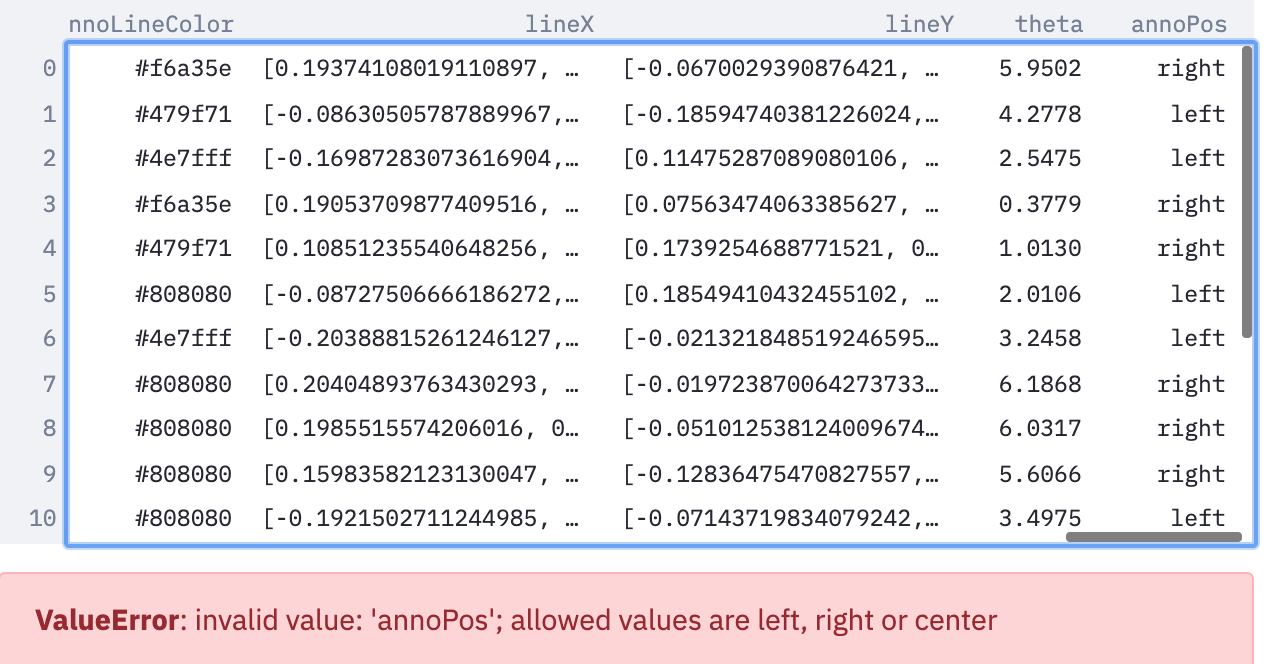
It throws an error about colors, but even if you manually change that, it still does not display the plot. I really dont know what’s going on here any help or a pointer to some clear resources would be very much appreciated!