☰Read-only archive⌕
Looking for help with Bokeh?

This is a read-only archive. Ask questions and join the conversation on GitHub.

Visit Community Support on GitHub →
Archived discussions · Captured October 28, 2026

Plot a Vertical Stacked Bar based on Groupby object based on multiple keys

Community Support
Andrea_Ciufo
Andrea_Ciufo

My Goal is to create an Example of Vertical Stacked Plot Based on a ColumnDataSource from a GroupBy Object.

I read the documentation and the example on Stacked Plot and ColumnDataSource but I didn’t find any solution to my problem.

I created a short example of two sales record grouped on:

  • Day 1 Day2
  • Category 1 - Category 2 - Category 3

import pandas as pd
import numpy as np

today_sales={‘Day’:np.zeros(10),‘Category’:[‘Phone’,‘Appliance’,‘Appliance’,‘Phone’,“Computer”,“Computer”,“Appliance”,‘Phone’, ‘Phone’, ‘Phone’], ‘Item’:[‘Iphone’,‘Dishwasher’,‘Fridge’,‘Samsung Galaxy’,“Laptop Asus”,“Laptop Sony Vaio”,“Lavatrice Bontempi”,“Samsung Galaxy”, “Nokia 3310”, “Motorola Startac”],‘Price’:[ 350,300,599,100,900,1200,650,500, 120, 60]}

yesterday_sales={‘Day’:np.ones(10),‘Category’:[‘Phone’,‘Appliance’,‘Appliance’,‘Phone’,“Computer”,“Computer”,“Appliance”,‘Phone’, ‘Phone’, ‘Phone’], ‘Item’:[‘Ericson T10’,‘Pinguino DeLonghi’,‘Freezer’,‘Motorola Razr’,“Laptop HP”,“Laptop Acer”,“Lavatrice Bontempi”,“Iphone”, “Nokia 3330”, “Motorola Startac”],‘Price’:[ 150,200,699,100,400,600,650,350, 120, 60]}

df_sales_today=pd.DataFrame(today_sales)

df_sales_yesterday=pd.DataFrame(yesterday_sales)

sales_two_day=df_sales_today.append(df_sales_yesterday)

two_day_category_sum=sales_two_day.groupby([‘Day’,‘Category’]).sum()

``

then I imported all the module that I needed

from bokeh.models import ColumnDataSource, Plot
from bokeh.models.glyphs import VBar
from bokeh.plotting import figure,curdoc
from bokeh.io import show,push_notebook, output_notebook,output_file
output_notebook()

``

And then I get stuck here:

p=figure(plot_height=250, title=‘Sales Comparison’)
data=ColumnDataSource(two_day_category_sum)
p.vbar_stack(x=‘Day_Category’,source=data, width=0.9)
show(p)

``

What is missing is the ‘Stackers’.

TypeError: vbar_stack() missing 1 required positional argument: 'stackers'

And It makes sense because I don't Know how to select.

The X should be "today" (1) and "Yesterday"(2) and on the vertical bar I would like to have the stack of the three categories

Thanks! :)

⌁   Link to post
Bryan
Bryan

Hi,

In contrast to most other usage in Bokeh, the stacked bar glyphs operate more on row-based data. To get data suitable for vbar_stack, you need to arrive at a data dict like:

  data = {
    'Day': ['1', '2'],
                'Appliance': [1549, 1549],
    'Computer': [2100, 1000],
    'Phone': [1130, 780]
  }

Then you can pass 'Day' for "x" and ['Appliance', 'Computer', 'Phone'] for the rows to stack.

But how to best obtain that from your groupie is a pandas question, I don't know the answer to offhand.

Thank,

Bryan

···

On Mar 2, 2019, at 3:33 AM, Andrea Ciufo <andciufo@gmail.com> wrote:

import pandas as pd
import numpy as np

today_sales={'Day':np.zeros(10),'Category':['Phone','Appliance','Appliance','Phone',"Computer","Computer","Appliance",'Phone', 'Phone', 'Phone'], 'Item':['Iphone','Dishwasher','Fridge','Samsung Galaxy',"Laptop Asus","Laptop Sony Vaio","Lavatrice Bontempi","Samsung Galaxy","Nokia 3310", "Motorola Startac"],'Price':[ 350,300,599,100,900,1200,650,500, 120, 60]}

yesterday_sales={'Day':np.ones(10),'Category':['Phone','Appliance','Appliance','Phone',"Computer","Computer","Appliance",'Phone', 'Phone', 'Phone'], 'Item':['Ericson T10','Pinguino DeLonghi','Freezer','Motorola Razr',"Laptop HP","Laptop Acer","Lavatrice Bontempi","Iphone", "Nokia 3330","Motorola Startac"],'Price':[ 150,200,699,100,400,600,650,350, 120, 60]}

df_sales_today=pd.DataFrame(today_sales)

df_sales_yesterday=pd.DataFrame(yesterday_sales)

sales_two_day=df_sales_today.append(df_sales_yesterday)

two_day_category_sum=sales_two_day.groupby(['Day','Category']).sum()

⌁   Link to post
Andrea_Ciufo
Andrea_Ciufo

Tnx Bryan!

···

On Monday, 4 March 2019 19:12:26 UTC+1, Bryan Van de ven wrote:

Hi,

In contrast to most other usage in Bokeh, the stacked bar glyphs operate more on row-based data. To get data suitable for vbar_stack, you need to arrive at a data dict like:

    data = {

            'Day': ['1', '2'],

            'Appliance': [1549, 1549],

            'Computer': [2100, 1000],

            'Phone': [1130, 780]

    }

Then you can pass ‘Day’ for “x” and [‘Appliance’, ‘Computer’, ‘Phone’] for the rows to stack.

But how to best obtain that from your groupie is a pandas question, I don’t know the answer to offhand.

Thank,

Bryan

On Mar 2, 2019, at 3:33 AM, Andrea Ciufo andc...@gmail.com wrote:

import pandas as pd
import numpy as np

today_sales={‘Day’:np.zeros(10),‘Category’:[‘Phone’,‘Appliance’,‘Appliance’,‘Phone’,“Computer”,“Computer”,“Appliance”,‘Phone’, ‘Phone’, ‘Phone’], ‘Item’:[‘Iphone’,‘Dishwasher’,‘Fridge’,‘Samsung Galaxy’,“Laptop Asus”,“Laptop Sony Vaio”,“Lavatrice Bontempi”,“Samsung Galaxy”,“Nokia 3310”, “Motorola Startac”],‘Price’:[ 350,300,599,100,900,1200,650,500, 120, 60]}

yesterday_sales={‘Day’:np.ones(10),‘Category’:[‘Phone’,‘Appliance’,‘Appliance’,‘Phone’,“Computer”,“Computer”,“Appliance”,‘Phone’, ‘Phone’, ‘Phone’], ‘Item’:[‘Ericson T10’,‘Pinguino DeLonghi’,‘Freezer’,‘Motorola Razr’,“Laptop HP”,“Laptop Acer”,“Lavatrice Bontempi”,“Iphone”, “Nokia 3330”,“Motorola Startac”],‘Price’:[ 150,200,699,100,400,600,650,350, 120, 60]}

df_sales_today=pd.DataFrame(today_sales)

df_sales_yesterday=pd.DataFrame(yesterday_sales)

sales_two_day=df_sales_today.append(df_sales_yesterday)

two_day_category_sum=sales_two_day.groupby([‘Day’,‘Category’]).sum()

⌁   Link to post
Andrea_Ciufo
Andrea_Ciufo

I don’t know if is better to open a new discussion or to continue here.

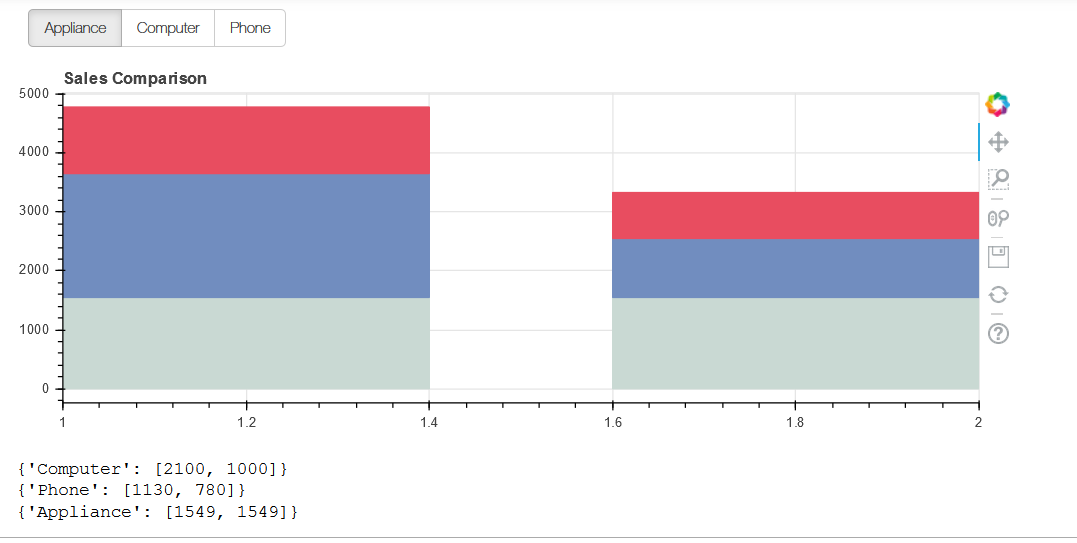
I am trying to create an interactive stacked plot where the user can select the stack.

  1. Is it possible?

In the documentation is clear, It States "Box" and not “Boxes”, but to be sure:

  1. Can I Select with the Radio Group Button multiple options or I have to use the Checkbox Widget?
  2. Is possible to plot the columns selected through the Radio Group Button (or the stacked plot)?
    I tried to understand how to update change data2.column_names[1:], but without useful results

I am able to print the key and values selected through the radio button group(and I am very happy about It, I am making progress :smiley: :smiley: :D) but not how to update the plot.

Here the new code:

colors = [“#c9d9d3”, “#718dbf”,“#e84d60”]

data={‘Day’: [1, 2],‘Appliance’: [1549,1549], ‘Computer’: [2100, 1000], ‘Phone’: [1130, 780]}

def modify_doc(doc):

keys=[‘Appliance’,‘Computer’,‘Phone’]

data2=ColumnDataSource(data)

p=figure(x_range=[1,2], title=‘Sales Comparison’, plot_width=800, plot_height=300)

p.vbar_stack(data2.column_names[1:], x=‘Day’, color=colors,source=data2, width=0.8)

def update_plot(attr, old, new):

pre_selection=data

key = keys[rbg.active]

selected_data={key:data[key]}

print(selected_data)

rbg = RadioButtonGroup(labels=keys,active=0)

rbg.on_change(‘active’, update_plot)

layout=column(rbg, p)

doc.add_root(layout)

show(modify_doc)

``

···

On Saturday, 2 March 2019 12:33:44 UTC+1, Andrea Ciufo wrote:

My Goal is to create an Example of Vertical Stacked Plot Based on a ColumnDataSource from a GroupBy Object.

I read the documentation and the example on Stacked Plot and ColumnDataSource but I didn’t find any solution to my problem.

I created a short example of two sales record grouped on:

  • Day 1 Day2
  • Category 1 - Category 2 - Category 3

import pandas as pd
import numpy as np

today_sales={‘Day’:np.zeros(10),‘Category’:[‘Phone’,‘Appliance’,‘Appliance’,‘Phone’,“Computer”,“Computer”,“Appliance”,‘Phone’, ‘Phone’, ‘Phone’], ‘Item’:[‘Iphone’,‘Dishwasher’,‘Fridge’,‘Samsung Galaxy’,“Laptop Asus”,“Laptop Sony Vaio”,“Lavatrice Bontempi”,“Samsung Galaxy”, “Nokia 3310”, “Motorola Startac”],‘Price’:[ 350,300,599,100,900,1200,650,500, 120, 60]}

yesterday_sales={‘Day’:np.ones(10),‘Category’:[‘Phone’,‘Appliance’,‘Appliance’,‘Phone’,“Computer”,“Computer”,“Appliance”,‘Phone’, ‘Phone’, ‘Phone’], ‘Item’:[‘Ericson T10’,‘Pinguino DeLonghi’,‘Freezer’,‘Motorola Razr’,“Laptop HP”,“Laptop Acer”,“Lavatrice Bontempi”,“Iphone”, “Nokia 3330”, “Motorola Startac”],‘Price’:[ 150,200,699,100,400,600,650,350, 120, 60]}

df_sales_today=pd.DataFrame(today_sales)

df_sales_yesterday=pd.DataFrame(yesterday_sales)

sales_two_day=df_sales_today.append(df_sales_yesterday)

two_day_category_sum=sales_two_day.groupby([‘Day’,‘Category’]).sum()

``

then I imported all the module that I needed

from bokeh.models import ColumnDataSource, Plot
from bokeh.models.glyphs import VBar
from bokeh.plotting import figure,curdoc
from bokeh.io import show,push_notebook, output_notebook,output_file
output_notebook()

``

And then I get stuck here:

p=figure(plot_height=250, title=‘Sales Comparison’)
data=ColumnDataSource(two_day_category_sum)
p.vbar_stack(x=‘Day_Category’,source=data, width=0.9)
show(p)

``

What is missing is the ‘Stackers’.

TypeError: vbar_stack() missing 1 required positional argument: 'stackers'

And It makes sense because I don’t Know how to select.

The X should be “today” (1) and “Yesterday”(2) and on the vertical bar I would like to have the stack of the three categories

Thanks! :slight_smile:

⌁   Link to post
Bryan
Bryan

Hi,

I don't think that updating stackers "after the fact" is really well supported at the moment. So instead I would suggest maybe plotting all three of the stacks at once up front but making all but one invisible. Then use the button callbacks to manage the .visible attribute of the glyphs appropriately.

Thanks,

Bryan

···

On Mar 9, 2019, at 10:04 AM, Andrea Ciufo <andciufo@gmail.com> wrote:

I don't know if is better to open a new discussion or to continue here.

I am trying to create an interactive stacked plot where the user can select the stack.
  • Is it possible?
In the documentation is clear, It States "Box" and not "Boxes", but to be sure:
  • Can I Select with the Radio Group Button multiple options or I have to use the Checkbox Widget?
  • Is possible to plot the columns selected through the Radio Group Button (or the stacked plot)?
I tried to understand how to update change data2.column_names[1:], but without useful results

I am able to print the key and values selected through the radio button group(and I am very happy about It, I am making progress :smiley: :smiley: :D) but not how to update the plot.

Here the new code:
colors = ["#c9d9d3", "#718dbf","#e84d60"]
data={'Day': [1, 2],'Appliance': [1549,1549], 'Computer': [2100, 1000], 'Phone': [1130, 780]}
def modify_doc(doc):
    keys=['Appliance','Computer','Phone']
    data2=ColumnDataSource(data)
    p=figure(x_range=[1,2], title='Sales Comparison', plot_width=800, plot_height=300)
    p.vbar_stack(data2.column_names[1:], x='Day', color=colors,source=data2, width=0.8)
    def update_plot(attr, old, new):
        pre_selection=data
        key = keys[rbg.active]
        selected_data={key:data[key]}
        print(selected_data)
        
    rbg = RadioButtonGroup(labels=keys,active=0)
    rbg.on_change('active', update_plot)
    layout=column(rbg, p)
    doc.add_root(layout)

show(modify_doc)

<testing.PNG>

On Saturday, 2 March 2019 12:33:44 UTC+1, Andrea Ciufo wrote:
My Goal is to create an Example of Vertical Stacked Plot Based on a ColumnDataSource from a GroupBy Object.

I read the documentation and the example on Stacked Plot and ColumnDataSource but I didn't find any solution to my problem.

I created a short example of two sales record grouped on:
  • Day 1 Day2
  • Category 1 - Category 2 - Category 3

import pandas as pd
import numpy as np

today_sales={'Day':np.zeros(10),'Category':['Phone','Appliance','Appliance','Phone',"Computer","Computer","Appliance",'Phone', 'Phone', 'Phone'], 'Item':['Iphone','Dishwasher','Fridge','Samsung Galaxy',"Laptop Asus","Laptop Sony Vaio","Lavatrice Bontempi","Samsung Galaxy", "Nokia 3310", "Motorola Startac"],'Price':[ 350,300,599,100,900,1200,650,500, 120, 60]}

yesterday_sales={'Day':np.ones(10),'Category':['Phone','Appliance','Appliance','Phone',"Computer","Computer","Appliance",'Phone', 'Phone', 'Phone'], 'Item':['Ericson T10','Pinguino DeLonghi','Freezer','Motorola Razr',"Laptop HP","Laptop Acer","Lavatrice Bontempi","Iphone", "Nokia 3330", "Motorola Startac"],'Price':[ 150,200,699,100,400,600,650,350, 120, 60]}

df_sales_today=pd.DataFrame(today_sales)

df_sales_yesterday=pd.DataFrame(yesterday_sales)

sales_two_day=df_sales_today.append(df_sales_yesterday)

two_day_category_sum=sales_two_day.groupby(['Day','Category']).sum()

then I imported all the module that I needed

from bokeh.models import ColumnDataSource, Plot
from bokeh.models.glyphs import VBar
from bokeh.plotting import figure,curdoc
from bokeh.io import show,push_notebook, output_notebook,output_file
output_notebook()

And then I get stuck here:

p=figure(plot_height=250, title='Sales Comparison')
data=ColumnDataSource(two_day_category_sum)
p.vbar_stack(x='Day_Category',source=data, width=0.9)
show(p)

What is missing is the 'Stackers'.
TypeError: vbar_stack() missing 1 required positional argument: 'stackers'
And It makes sense because I don't Know how to select.

The X should be "today" (1) and "Yesterday"(2) and on the vertical bar I would like to have the stack of the three categories

Thanks! :slight_smile:

--
You received this message because you are subscribed to the Google Groups "Bokeh Discussion - Public" group.
To unsubscribe from this group and stop receiving emails from it, send an email to bokeh+unsubscribe@continuum.io.
To post to this group, send email to bokeh@continuum.io.
To view this discussion on the web visit https://groups.google.com/a/continuum.io/d/msgid/bokeh/9ff37130-1e7b-4931-925f-b8bdc7062e15%40continuum.io\.
For more options, visit https://groups.google.com/a/continuum.io/d/optout\.
<testing.PNG>

⌁   Link to post
Andrea_Ciufo
Andrea_Ciufo

Hi Bryan thanks for your patience! :slight_smile:
I will study the documentation, in particular this section about Visible Property

ps I started writing some basic posts about bokeh in Italian language, hoping it could be helpful for the community :slight_smile:

···

On Monday, 11 March 2019 16:35:44 UTC+1, Bryan Van de ven wrote:

Hi,

I don’t think that updating stackers “after the fact” is really well supported at the moment. So instead I would suggest maybe plotting all three of the stacks at once up front but making all but one invisible. Then use the button callbacks to manage the .visible attribute of the glyphs appropriately.

Thanks,

Bryan

On Mar 9, 2019, at 10:04 AM, Andrea Ciufo andc...@gmail.com wrote:

I don’t know if is better to open a new discussion or to continue here.

I am trying to create an interactive stacked plot where the user can select the stack.

    • Is it possible?

In the documentation is clear, It States “Box” and not “Boxes”, but to be sure:

    • Can I Select with the Radio Group Button multiple options or I have to use the Checkbox Widget?
    • Is possible to plot the columns selected through the Radio Group Button (or the stacked plot)?

I tried to understand how to update change data2.column_names[1:], but without useful results

I am able to print the key and values selected through the radio button group(and I am very happy about It, I am making progress :smiley: :smiley: :D) but not how to update the plot.

Here the new code:
colors = [“#c9d9d3”, “#718dbf”,“#e84d60”]

data={‘Day’: [1, 2],‘Appliance’: [1549,1549], ‘Computer’: [2100, 1000], ‘Phone’: [1130, 780]}

def modify_doc(doc):

keys=['Appliance','Computer','Phone']
data2=ColumnDataSource(data)
p=figure(x_range=[1,2], title='Sales Comparison', plot_width=800, plot_height=300)
p.vbar_stack(data2.column_names[1:], x='Day', color=colors,source=data2, width=0.8)
def update_plot(attr, old, new):
    pre_selection=data
    key =  keys[rbg.active]
    selected_data={key:data[key]}
    print(selected_data)
rbg = RadioButtonGroup(labels=keys,active=0)
rbg.on_change('active', update_plot)
layout=column(rbg, p)
doc.add_root(layout)

show(modify_doc)

<testing.PNG>

On Saturday, 2 March 2019 12:33:44 UTC+1, Andrea Ciufo wrote:

My Goal is to create an Example of Vertical Stacked Plot Based on a ColumnDataSource from a GroupBy Object.

I read the documentation and the example on Stacked Plot and ColumnDataSource but I didn’t find any solution to my problem.

I created a short example of two sales record grouped on:

    • Day 1 Day2
    • Category 1 - Category 2 - Category 3

import pandas as pd
import numpy as np

today_sales={‘Day’:np.zeros(10),‘Category’:[‘Phone’,‘Appliance’,‘Appliance’,‘Phone’,“Computer”,“Computer”,“Appliance”,‘Phone’, ‘Phone’, ‘Phone’], ‘Item’:[‘Iphone’,‘Dishwasher’,‘Fridge’,‘Samsung Galaxy’,“Laptop Asus”,“Laptop Sony Vaio”,“Lavatrice Bontempi”,“Samsung Galaxy”, “Nokia 3310”, “Motorola Startac”],‘Price’:[ 350,300,599,100,900,1200,650,500, 120, 60]}

yesterday_sales={‘Day’:np.ones(10),‘Category’:[‘Phone’,‘Appliance’,‘Appliance’,‘Phone’,“Computer”,“Computer”,“Appliance”,‘Phone’, ‘Phone’, ‘Phone’], ‘Item’:[‘Ericson T10’,‘Pinguino DeLonghi’,‘Freezer’,‘Motorola Razr’,“Laptop HP”,“Laptop Acer”,“Lavatrice Bontempi”,“Iphone”, “Nokia 3330”, “Motorola Startac”],‘Price’:[ 150,200,699,100,400,600,650,350, 120, 60]}

df_sales_today=pd.DataFrame(today_sales)

df_sales_yesterday=pd.DataFrame(yesterday_sales)

sales_two_day=df_sales_today.append(df_sales_yesterday)

two_day_category_sum=sales_two_day.groupby([‘Day’,‘Category’]).sum()

then I imported all the module that I needed

from bokeh.models import ColumnDataSource, Plot

from bokeh.models.glyphs import VBar

from bokeh.plotting import figure,curdoc

from bokeh.io import show,push_notebook, output_notebook,output_file

output_notebook()

And then I get stuck here:

p=figure(plot_height=250, title=‘Sales Comparison’)

data=ColumnDataSource(two_day_category_sum)

p.vbar_stack(x=‘Day_Category’,source=data, width=0.9)

show(p)

What is missing is the ‘Stackers’.

TypeError: vbar_stack() missing 1 required positional argument: ‘stackers’

And It makes sense because I don’t Know how to select.

The X should be “today” (1) and “Yesterday”(2) and on the vertical bar I would like to have the stack of the three categories

Thanks! :slight_smile:

–
You received this message because you are subscribed to the Google Groups “Bokeh Discussion - Public” group.

To unsubscribe from this group and stop receiving emails from it, send an email to bokeh+un...@continuum.io.

To post to this group, send email to bo...@continuum.io.

To view this discussion on the web visit https://groups.google.com/a/continuum.io/d/msgid/bokeh/9ff37130-1e7b-4931-925f-b8bdc7062e15%40continuum.io.

For more options, visit https://groups.google.com/a/continuum.io/d/optout.

<testing.PNG>

⌁   Link to post

End of archived discussion · Replies are disabled