Thanks @carolyn this is very useful. There are couple of extra things that I’d like to know if they are possible. I’m going over the documentation but can’t seem to find them. I want to see if any of this is possible. I added couple of things to the plot (see code)
from bokeh.plotting import figure, show
from bokeh.models import Label, Button, CustomJS, Title
from bokeh.layouts import column, row

x = [1, 2, 3, 4, 5, 6]
y = [4, 8, 2, 7, 4, 6]

p = figure()

title_test = Title(text="TESTING", text_font_style="italic", align ="left", text_font_size = "25px")

p.line(x=x, y=y)

p.add_layout(title_test, "above")

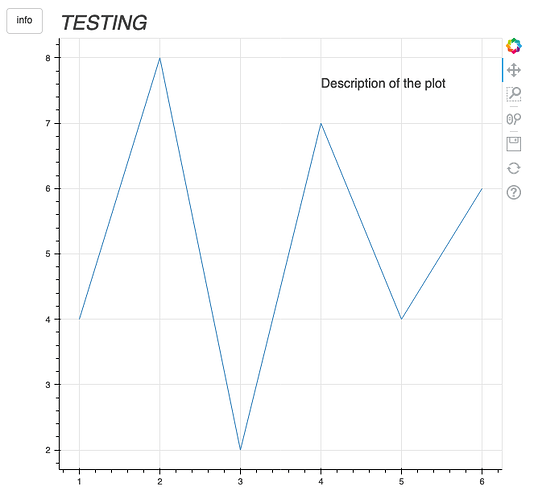
my_label = Label(x=4, y=7.5, text="Description of the plot")
my_label.visible = False

p.add_layout(my_label)

callback = CustomJS(args=dict(my_label=my_label), code="""

    // if it's visible now, make it INvisible...
    if (my_label.visible == true)
      my_label.visible = false;
    // otherwise, make it visible.
    else
      my_label.visible = true;
""")

button = Button(label="info")
button.js_on_click(callback)

show(row(column(button, width=50), p))
Which results in this plot
Now what I would like to know is if it is possible to:
- Either make the Title the button or being able to put the button right next to the Title. Like and info button that when clicked would described the plot.
So far I was able to locate next to it to the left, or all the way to the right but it takes a column space that I’d like to avoid.
- Is it possible to edit the font size, font style and background of the button?, I found there are different styles of buttons like
button_type="warning" or “sucess” but is there a way of customize it differently? or make a png image to be the button if not.
- The text that gets display after hitting the button is raw text, is there a way for this to be html like the `Div. (see docs here) that would display when hitting the button.
The main goal of this is to be able to get a description of the type of plot without having to go to an external link, and that looks on the plot or over a part of the plot when we hit the button. I know I asked a lot of questions, I’m fairly new to Bokeh and I’m having a bit of trouble finding things on the docs, so apologies if the questions are answered somewhere else in docs.
