
Hi, i got a basic app in jupyter notebook consisting on:
- A 2D interactive plot where you can move points
- A 3D plot where the points are shown as a 3D plot
- You can switch between both plots using a radioButton
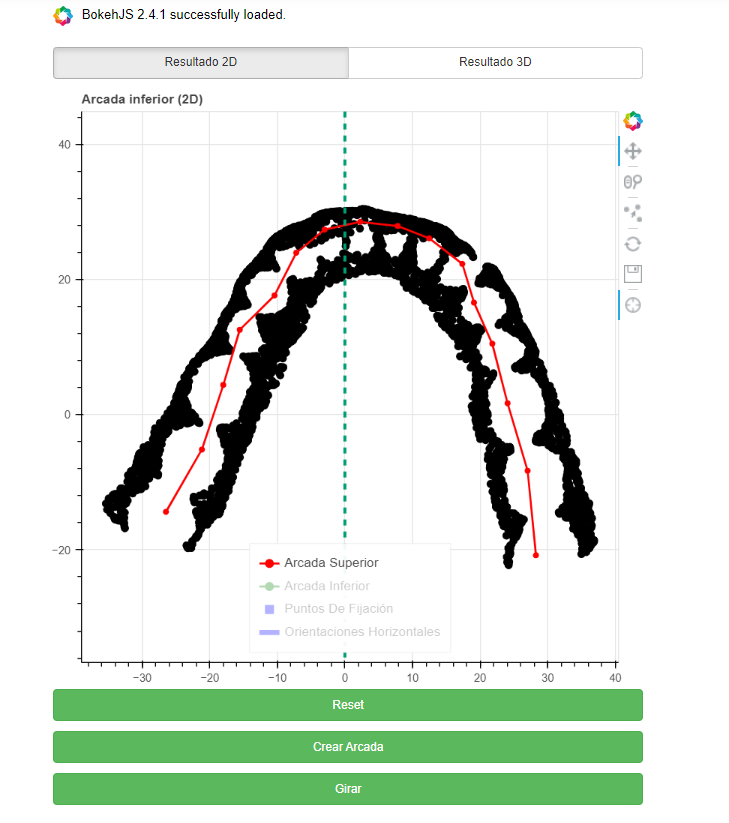
The problem is that the points that are plotted in the 2D plot are part of a 3D Mesh (a model of a human jaw) and the 3D plot plots a 3D Graph (Instead of a mesh like the one in the image below). I used the example from the bokeh documentation Wrapping a javascript library example.
I want to wrap something similar to a plotly mesh, like this one:
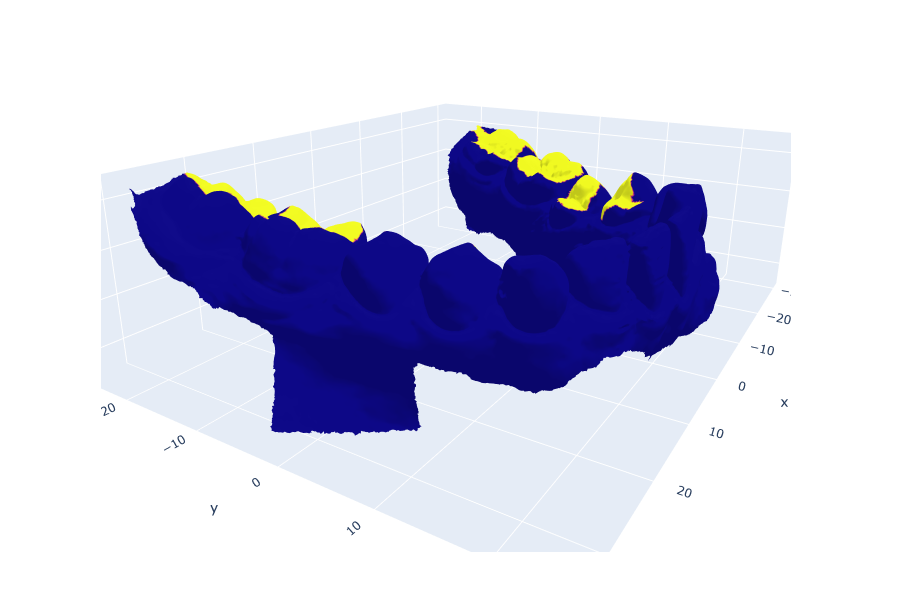
Do you know any code which can be wrapped like the Surface3D from the example? or a way of embedding the plotly mesh3D into a plot?, any suggestion is more than welcomed