Hi,
I am developing an app using the following modules:
Python: 3.7
Bokeh: 2.3.2
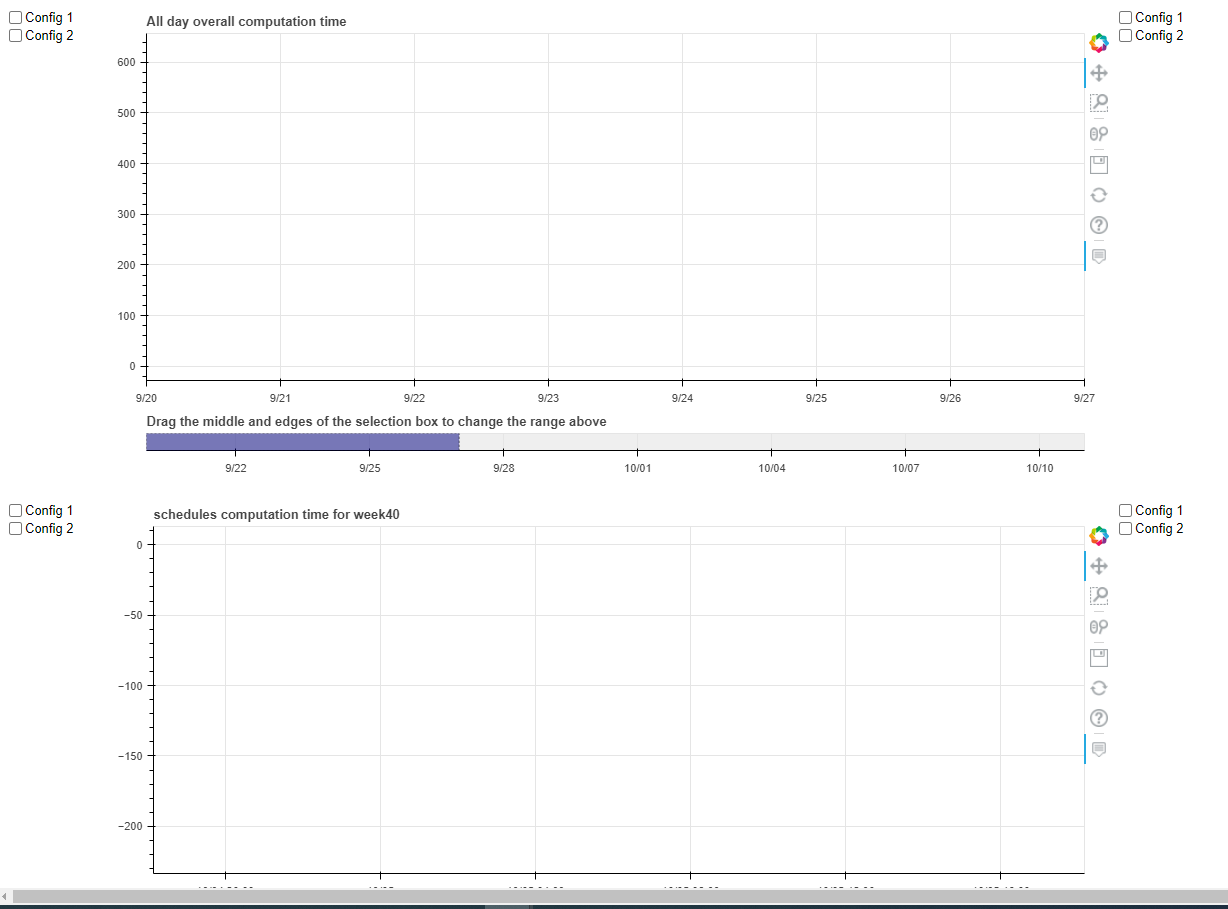
The app build an html file with multiple plots. The attached file
show the layout when the html is loaded. Only the first plot is shown. If I move my mouse cursor as drawn on the above picture then the missing plot shows up !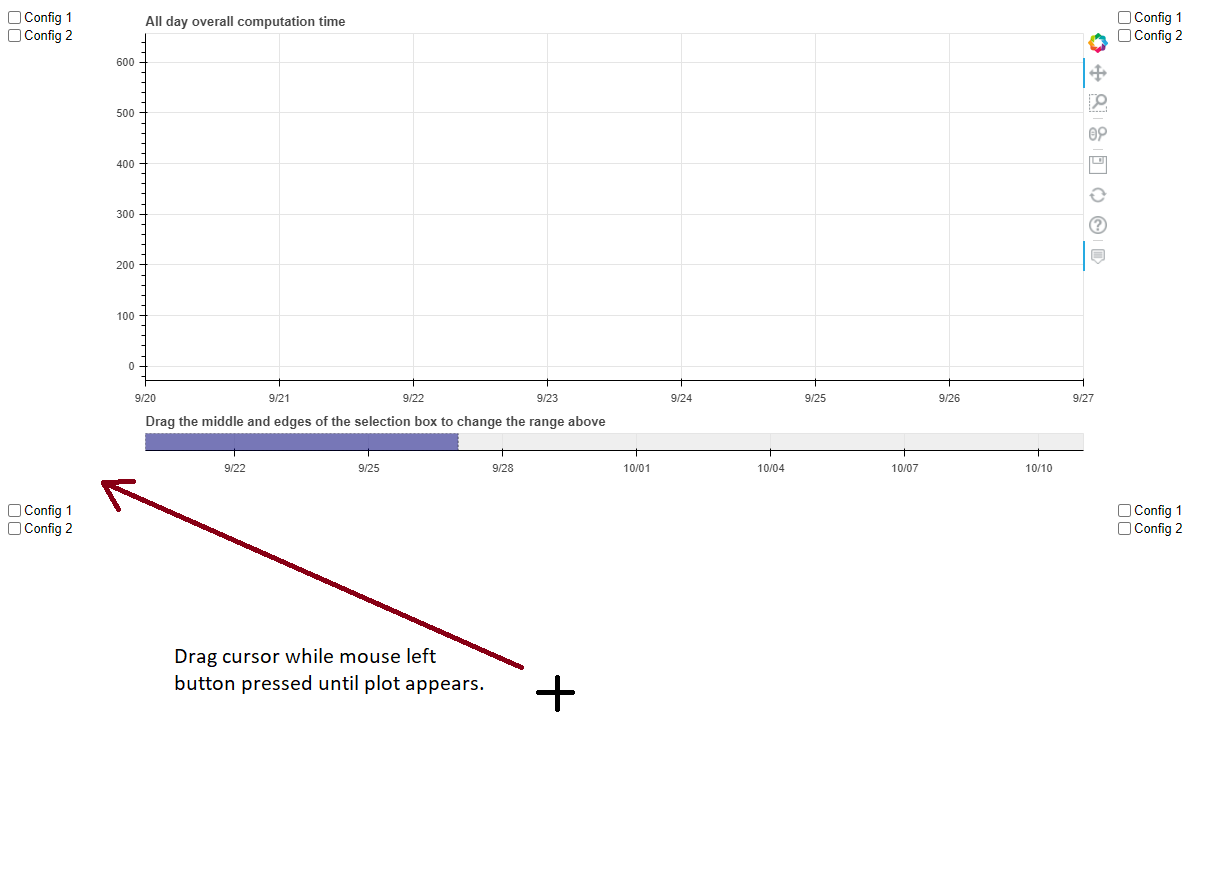
Also not sure if it is related but I get the following exception on the browser console:
Uncaught TypeError: Cannot read properties of undefined (reading ‘get_ticks_no_defaults’)
at T.get_ticks_no_defaults (schedules_computation_time.html:379)
at T.get_ticks (schedules_computation_time.html:364)
at h.grid_coords (schedules_computation_time.html:523)
at h._draw_grids (schedules_computation_time.html:523)
at h._render (schedules_computation_time.html:523)
at h.render (schedules_computation_time.html:226)
at R._paint_levels (schedules_computation_time.html:540)
at R.paint (schedules_computation_time.html:540)
at R.after_layout (schedules_computation_time.html:540)
at u.after_layout (schedules_computation_time.html:526)
I will try to create minimal example but it will not be easy. Could I share the html file instead?
thanks
Gilles