Hi Bokeh,
I’m hoping the community can help me understand the best way to accomplish a plot. I’m hoping to be able
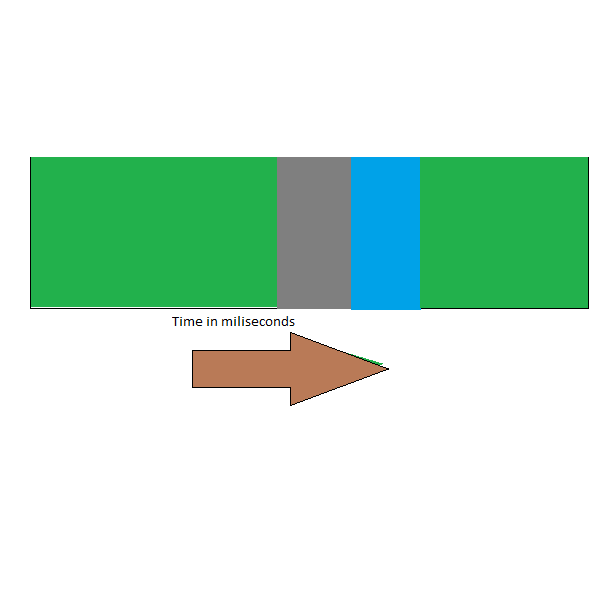
- to visualise vertical bars of at least 1px width to represent 1 millisecond (zooming out to facilitate clearer changes in cluster)
- which is coloured according to their cluster membership id
- with no spacing between the bars
- the height isn’t important and can be set to a constant value
as the timeline goes from left to right. I’d also like to implement zoom and annotations for each time slice/vertical bar.
The dataset would range in size from a few hundred to 3000 records.
If you consider the attached image and imagine each coloured block is formed from individual coloured vertical slices stacked from left to right and as the user moves over the slices the annotations would show slice specific data
I was thinking vbar might be the best starting place but I don’t know if its correct to use so many vbars to represent individual slices or if its possible to collapse the padding so the bars look like 1 solid bar
Any suggestions or advice would be welcome
Michael
Hey Micheal,
You may want to consider using rect glyphs instead of vbar. The advantage of using rect glyphs is that you can define a left and right value to each rect. This might be easier than trying to find the right width value when using vbars. You can also set line_color=None to remove the outline from your glyphs.
Tyler
···
On Mon, Mar 6, 2017 at 7:56 AM, Michael O’Brien [email protected] wrote:
Hi Bokeh,
I’m hoping the community can help me understand the best way to accomplish a plot. I’m hoping to be able
- to visualise vertical bars of at least 1px width to represent 1 millisecond (zooming out to facilitate clearer changes in cluster)
- which is coloured according to their cluster membership id
- with no spacing between the bars
- the height isn’t important and can be set to a constant value
as the timeline goes from left to right. I’d also like to implement zoom and annotations for each time slice/vertical bar.
The dataset would range in size from a few hundred to 3000 records.
If you consider the attached image and imagine each coloured block is formed from individual coloured vertical slices stacked from left to right and as the user moves over the slices the annotations would show slice specific data
I was thinking vbar might be the best starting place but I don’t know if its correct to use so many vbars to represent individual slices or if its possible to collapse the padding so the bars look like 1 solid bar
Any suggestions or advice would be welcome
Michael
–
You received this message because you are subscribed to the Google Groups “Bokeh Discussion - Public” group.
To unsubscribe from this group and stop receiving emails from it, send an email to [email protected].
To post to this group, send email to [email protected].
To view this discussion on the web visit https://groups.google.com/a/continuum.io/d/msgid/bokeh/4adf9058-220e-4997-b87c-329ad52268e9%40continuum.io.
For more options, visit https://groups.google.com/a/continuum.io/d/optout.
Thanks I’ll take a look. I’m also thinking that holoview spikes might be what I’m after Bokeh Elements — HoloViews
···
On Wednesday, 8 March 2017 03:39:43 UTC, Tyler Nickerson wrote:
Hey Micheal,
You may want to consider using rect glyphs instead of vbar. The advantage of using rect glyphs is that you can define a left and right value to each rect. This might be easier than trying to find the right width value when using vbars. You can also set line_color=None to remove the outline from your glyphs.
Tyler
On Mon, Mar 6, 2017 at 7:56 AM, Michael O’Brien [email protected] wrote:
Hi Bokeh,
I’m hoping the community can help me understand the best way to accomplish a plot. I’m hoping to be able
- to visualise vertical bars of at least 1px width to represent 1 millisecond (zooming out to facilitate clearer changes in cluster)
- which is coloured according to their cluster membership id
- with no spacing between the bars
- the height isn’t important and can be set to a constant value
as the timeline goes from left to right. I’d also like to implement zoom and annotations for each time slice/vertical bar.
The dataset would range in size from a few hundred to 3000 records.
If you consider the attached image and imagine each coloured block is formed from individual coloured vertical slices stacked from left to right and as the user moves over the slices the annotations would show slice specific data
I was thinking vbar might be the best starting place but I don’t know if its correct to use so many vbars to represent individual slices or if its possible to collapse the padding so the bars look like 1 solid bar
Any suggestions or advice would be welcome
Michael
–
You received this message because you are subscribed to the Google Groups “Bokeh Discussion - Public” group.
To unsubscribe from this group and stop receiving emails from it, send an email to [email protected].
To post to this group, send email to [email protected].
To view this discussion on the web visit https://groups.google.com/a/continuum.io/d/msgid/bokeh/4adf9058-220e-4997-b87c-329ad52268e9%40continuum.io.
For more options, visit https://groups.google.com/a/continuum.io/d/optout.