···
On Thu, Sep 22, 2016 at 4:52 PM, Saurabh Heda saurabh0.heda@gmail.com wrote:
Somehow managed to plot Bar using rect but now the problem is related to the x axis labels. following is the code to plot the rectangle.
def make_plot_promotype(source, title):
- label=[‘promo1’,‘promo2’,‘promo3’,‘promo4’]*
- yr = DataRange1d(start=0, bounds=None)*
- plot = Figure(plot_width=500, plot_height=400, toolbar_location=“above”,y_range=yr)*
- plot.rect(x=‘promotion_type’,y=‘valuebytwo’,source=source, width =0.5, height = ‘value’, legend=title)*
- plot.xaxis.major_label_orientation = np.pi/4 # radians, “horizontal”, “vertical”, “normal”*
source is the columndatasource which is pandas dataframe. promotion_type, valuebytwo and value are the columns of the dataframe.
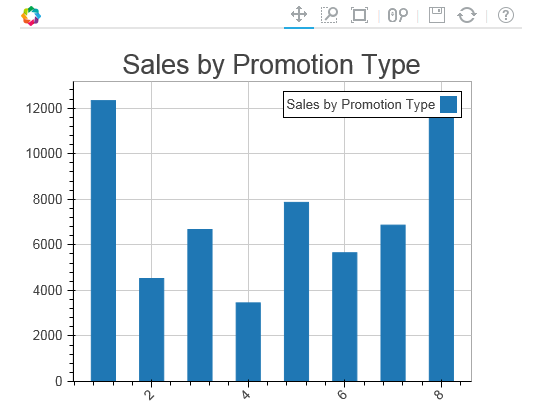
<image.png>
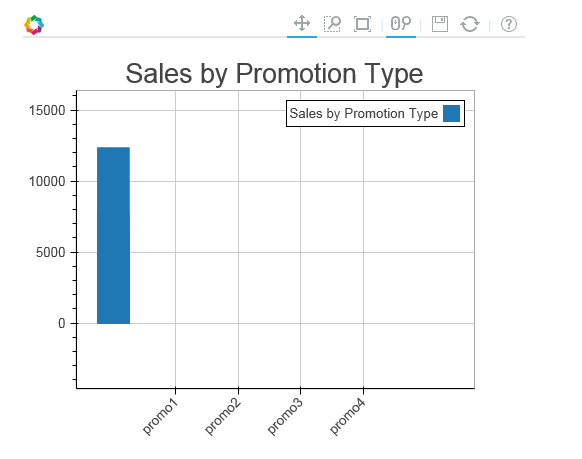
Above is the plot we get while x_range = label is not supplied but while figure is supplied with x_range = label getting the below curve.
plot = Figure(x_range=label,plot_width=500, plot_height=400, toolbar_location=“above”,y_range=yr)
<image.png>
–
On Tue, Sep 20, 2016 at 9:54 AM, Saurabh Heda saurabh0.heda@gmail.com wrote:
Hi Team,
I was trying to plot bar graph using bokeh and facing following issues.
- Interactivity is not there, I am using bokeh.charts and Bar library to create bar charts.
Below is the detail of the plot/function I am using:
def make_plot_promotype(source, title):
df=source.to_df()
bar = Bar(df,‘promotion_type’,values=‘value’,title=title)
return bar
Below is how I am calling this make_plot_promotype function
plot_sales_by_promo = make_plot_promotype(source_sales_by_promo, “Sales by Promotion Type”)
Now plotting this bar chart using
curdoc().add_root(HBox(plot_sales_by_promo))
The problem with the above code is that I am seeing two curves while running this application through bokeh server. One where I have called
plot_sales_by_promo = make_plot_promotype(source_sales_by_promo, “Sales by Promotion Type”)
and another is inside curdoc() function.
for implementing interactivity I am using call backs like this:
year_select.on_change(‘value’,update_plot)
where inside update_plot I am changing and update the source dataframe.
- Another problem with bokeh bar charts is that I want labels as strings on the X-axis but could not do this.
Appreciate your help on the same team.
Thanks,
Saurabh Heda
–
You received this message because you are subscribed to the Google Groups “Bokeh Discussion - Public” group.
To unsubscribe from this group and stop receiving emails from it, send an email to bokeh+unsubscribe@continuum.io.
To post to this group, send email to bokeh@continuum.io.
To view this discussion on the web visit https://groups.google.com/a/continuum.io/d/msgid/bokeh/8e47f152-c056-4259-a026-220af56ed122%40continuum.io.
For more options, visit https://groups.google.com/a/continuum.io/d/optout.
Regards
Saurabh Heda
www.pg4research.blogspot.com
home.iitj.ac.in/~saurabh.heda
–
Regards
Saurabh Heda
www.pg4research.blogspot.com
home.iitj.ac.in/~saurabh.heda