
☰Read-only archive⌕
Looking for help with Bokeh?

This is a read-only archive. Ask questions and join the conversation on GitHub.

Visit Community Support on GitHub →
Archived discussions · Captured October 28, 2026

Plotting multiple channels in one graph

Community Support
Marcos_Herrero
Marcos_Herrero

Hello!
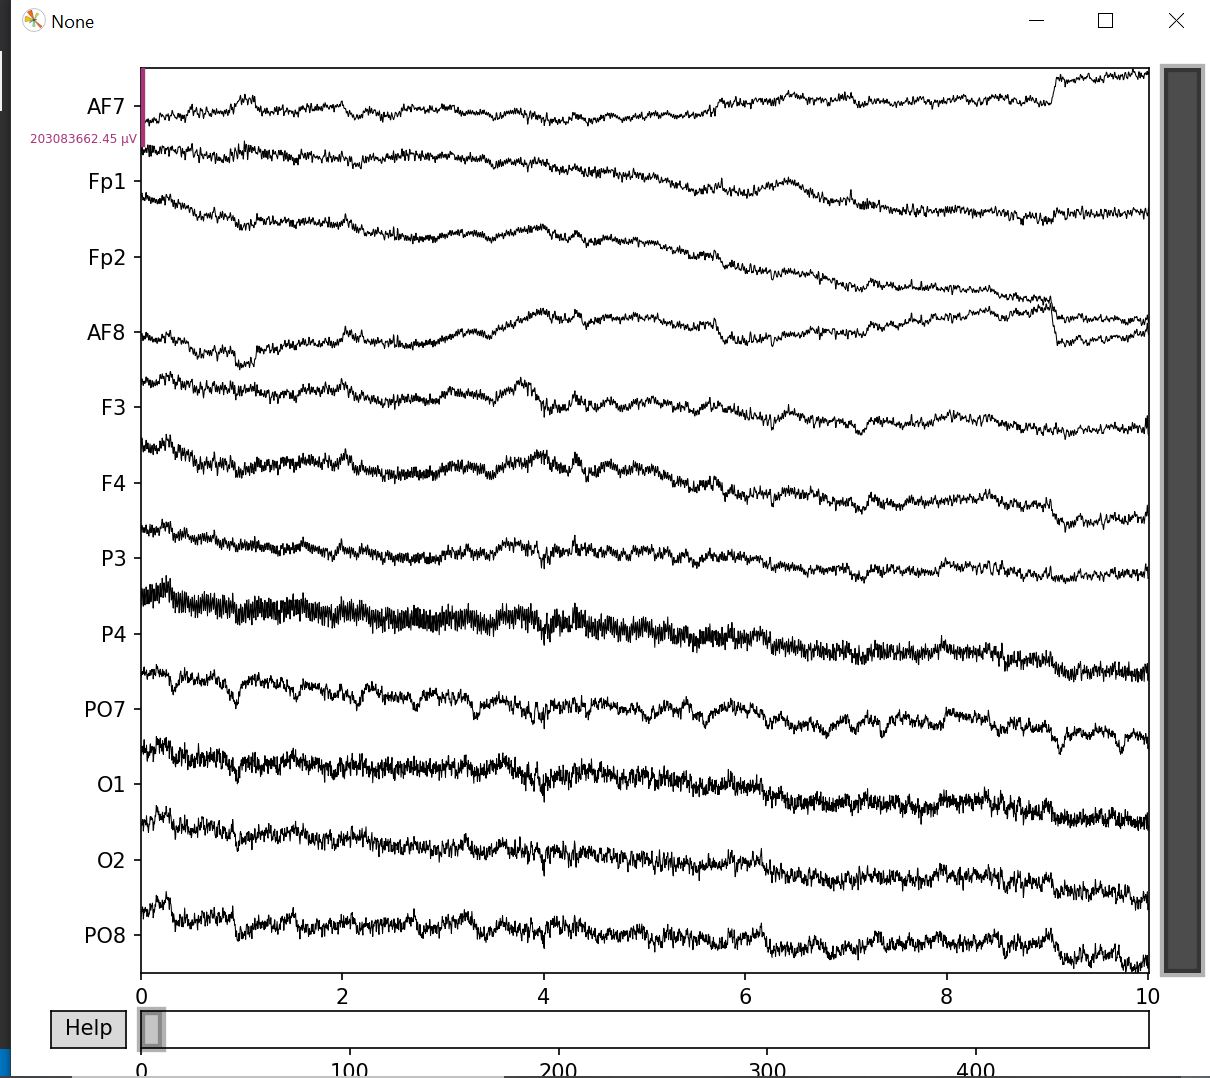
I am currently trying to generate a plot of a multidimensional array (12 channels) of EEG data.
I’d like to visualize the data ordered by number of channel, like in the first picture.
I’ve tried to get something like this, but if I try to plot all the channels in the same graph, they all have the same scale and the order is lost. The closer I got is using the column layout function, but still I’d like to have that same distribution in the same chart.
Is it possible?

Thank you in advance!
⌁   Link to post
James_A_Bednar1
James_A_Bednar1

We’re working on adding better support for precisely this case! I can’t promise when that would be ready, but you can reach out to me via user jbednar at github and we can keep you posted on our progress.

⌁   Link to post

End of archived discussion · Replies are disabled