Hi,
Bokeh can certainly draw plots like or similar to the one you show, e,g.
[https://bokeh.pydata.org/en/latest/docs/gallery/burtin.html](https://bokeh.pydata.org/en/latest/docs/gallery/burtin.html)
But Bokeh does not have built in capability for:
-
mapping polar coordinates (either on the Python or Javascript sides)
-
drawing polar axes and labels, etc.
So currently to produce a chart like the one you show, all of that work has to be done “by hand”.
There is an existing old issue regarding adding support for polar mappings:
[https://github.com/bokeh/bokeh/issues/657](https://github.com/bokeh/bokeh/issues/657)
And there is even a small proof of concept using CustomJSTransform in one of the comments. If someone is interested in working on this, i.e. to create a more supported, built-in capability, I’d be happy to help advise/provide guidance. I think it’s unlikely given current available resources that anyone on the core team will be able to prioritize it in the near future.
Thanks,
Bryan
On Feb 7, 2019, at 13:01, johnda...@gmail.com wrote:
Hello,
Is there a polar plot available in Bokeh?
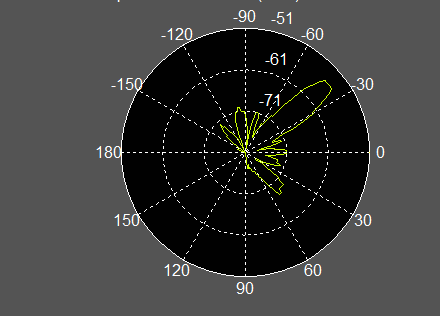
I try to plot polar graph like the following picture but i couldn’t find a way to do it in Bokeh.
<polar.png>
I think that is one of type of the plot that developer team may consider to add to Bokeh.
Seaborn does have polar projection but i couldn’t find in Bokeh
https://seaborn.pydata.org/examples/facet_projections.html
Thank you,
John
–
You received this message because you are subscribed to the Google Groups “Bokeh Discussion - Public” group.
To unsubscribe from this group and stop receiving emails from it, send an email to bokeh+un...@continuum.io.
To post to this group, send email to bo...@continuum.io.
To view this discussion on the web visit https://groups.google.com/a/continuum.io/d/msgid/bokeh/ed4d16ae-b4b6-4dd6-881b-f3a596f4b893%40continuum.io.
For more options, visit https://groups.google.com/a/continuum.io/d/optout.
<polar.png>