Problem plotting image with AjaxDataSource

Hi,

I have some problems with plotting image with AjaxDataSource.

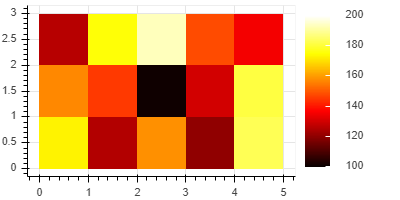
The first plot here shows the display obtained by save(fig). It works.
bokeh_plot%20(21)

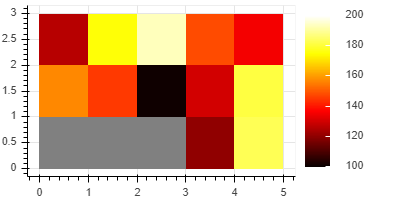
The second plot displays the index web page. As you can see the color_mapper is not apply on the first 3 pixels and the figure is not updated by the data from the ‘profile_data’ route.
bokeh_plot%20(20)

The code:

from flask import Flask
from jinja2 import Template
import numpy as np
from bokeh.plotting import figure, save, output_file
from bokeh.embed import components
from bokeh.resources import INLINE
from bokeh.models import AjaxDataSource, LinearColorMapper, ColorBar
from bokeh.core.json_encoder import serialize_json
from matplotlib import cm

# hot color map from matplotlib 
hot = [f'#{r[0]:02X}{r[1]:02X}{r[2]:02X}' for r in cm.hot(range(256), bytes=True)]

pixH, pixW = 3, 5
tMin, tMax = 100, 200

page = Template("""
<!DOCTYPE html>
<html lang="en">
    <head>
        <title>Ajax data source</title>
        {{ resources|indent(4)|safe }}        
        {{ script|indent(4)|safe }}
    </head>
    <body>
        {{ div|indent(4)|safe }}
    </body>
</html>
""")

# Initialize the Flask application
app = Flask(__name__)

@app.route('/')
def index():
    color_mapper = LinearColorMapper(palette=hot, low=tMin, high=tMax)
    im = np.uint16(np.random.rand(pixH, pixW)*(tMax-tMin)+tMin)
    source = AjaxDataSource(data_url="profile_data", polling_interval=3000)
    source.data=dict(im=[im])
    fig = figure(plot_width=400, plot_height=200)#, x_range=(0, pixW), y_range=(0, pixH))#, output_backend="webgl")# 
    fig.image(image='im', x=0, y=0, dw=pixW, dh=pixH, source=source, color_mapper=color_mapper)

    color_bar = ColorBar(color_mapper=color_mapper, label_standoff=12, border_line_color=None, location=(0,0))
    fig.add_layout(color_bar, 'right')

    output_file('image.html', title='output file')
    save(fig)

    script, div = components(fig, INLINE)
    return(page.render(resources=INLINE.render(), div=div, script=script))

@app.route('/profile_data', methods=['GET','POST'])
def Profile():
    im = np.uint16(np.random.rand(pixH, pixW)*(tMax-tMin)+tMin)
    return(serialize_json(dict(im=[im])))

if __name__ == '__main__':
    app.run(port=80)

Thank you for your support.

@jfp After some quick poking around, I am willing to believe there is some bugged interaction specific to AjaxDataSource and image glyphs, perhaps due to the multi-dimensional nature of of image (which is unlike almost all other “regular” glyphs). So at this point I’d suggest making a GitHub issue with all this information.

That said, I would not expect the code, as-written, to be useful. The default mode of the AjaxDataSource is to append and accumulate new items in a column. In this case that would mean accumulating many entire new images at the same time (since Image can draw many images at once). Perhaps you intend mode='replace' for the source.

1 Like

Thank you for your quick feedback.
This code was prepared for an evaluation of Bokeh for display of real time data of a sensor. The sensor produces a 2Dmap (25 x 128: 25 points in the x axis, and 128 points in the y axis). The idea is to append every second this small 2Dmap using AjaxDataSource, for a total duration of about 1 minute.
In this test the mode is set to ‘replace’ (default), in the final application it will use the mode ‘append’. Note that this mode is also not working.

@jfp I am a little unclear about your use case. Are you trying to stream e.g. additional columns or rows to one image? Or you are trying to stream additional images. Because the mode="append" will do the latter. Streaming to images is by its nature more complicated than streaming to scatter or time-series.

You might have a look at the spectrogram example:

bokeh/examples/app/spectrogram at branch-3.0 · bokeh/bokeh · GitHub

spec

That paints a more realistic image what’s required for streaming data to an image, one new column of pixels at a time. It uses a custom extension to handle a rotating buffer of sub-images and to handle updating the latest column and shifting the viewport accordingly. This is in the context of a Bokeh server app, but you could certainy make a custom DataSource that hit some REST endpoint that did similar things in a standalone HTML case.

Alternatively, if you could take the spectrogram code fairly as-is and simply rip out the parts that generate the audio data, and replace them with your code to hit a REST endpoint or whatever, if you can run things as a Bokeh server app.

The figure below shows the image plot and DataTable with mode=‘append’ and max_size=3. Only the last item 2 is displayed. I was expecting that the 3 images will be displayed. Item 0 display on the left, item 1 in the middle and item 2 to the right.

Eventually I am thinking of using adapter customJS to combine the images and transfer only the new pixels.

@jfp are you also streaming new coordinates in addition to the pixel data? the original code ahed fixed values for x, y so I would expect things to plot on top of one another if that’s the case. Realistically can’t say much more without real code to run.

I am streaming only the pixel data.
The code is below, the changes are init of ajax with empty image, mode=‘append’, max_size=3 and addition of the DataTable to see the data.
Only the last image is displayed. The 2 first images are lost.

from flask import Flask
from jinja2 import Template
import numpy as np
from bokeh.plotting import figure
from bokeh.embed import components
from bokeh.resources import INLINE
from bokeh.models import AjaxDataSource, LinearColorMapper, ColorBar
from bokeh.core.json_encoder import serialize_json
from bokeh.models.widgets import DataTable, TableColumn
from bokeh.layouts import column
from matplotlib import cm

# hot color map from matplotlib 
hot = [f'#{r[0]:02X}{r[1]:02X}{r[2]:02X}' for r in cm.hot(range(256), bytes=True)]

pixH, pixW = 3, 5
tMin, tMax = 100, 200

page = Template("""
<!DOCTYPE html>
<html lang="en">
    <head>
        <title>Ajax data source</title>
        {{ resources|indent(4)|safe }}        
        {{ script|indent(4)|safe }}
    </head>
    <body>
        {{ div|indent(4)|safe }}
    </body>
</html>
""")

# Initialize the Flask application
app = Flask(__name__)

@app.route('/')
def index():
    color_mapper = LinearColorMapper(palette=hot, low=tMin, high=tMax)
    source = AjaxDataSource(data_url="profile_data", polling_interval=3000, mode='append', max_size=3)
    source.data=dict(im=[])
    fig = figure(plot_width=500, plot_height=200)
    fig.image(image='im', x=0, y=0, dw=pixW, dh=pixH, source=source, color_mapper=color_mapper)

    color_bar = ColorBar(color_mapper=color_mapper, label_standoff=12, border_line_color=None, location=(0,0))
    fig.add_layout(color_bar, 'right')

    columns = [TableColumn(field='im', title='temp')]
    data_table = DataTable(source=source, columns=columns, width=400, height=400)    
    
    col = column(fig, data_table)

    script, div = components(col, INLINE)
    return(page.render(resources=INLINE.render(), div=div, script=script))

@app.route('/profile_data', methods=['GET','POST'])
def Profile():
    im = np.uint16(np.random.rand(pixH, pixW)*(tMax-tMin)+tMin)
    return(serialize_json(dict(im=[im])))

if __name__ == '__main__':
    app.run(port=80)

@jfp as I mentioned earlier, you have set fixed constant position

x=0, y=0 

in your glyph method. That means all those images will all always render to that same position (i.e. on top of one another). As it is, I can’t tell whether the images are actually missing, or whether they are simply plotted on top of one another (leaving only one visible on top).

If you want images in different locations, you will have to tell Bokeh that. I.e. you need to put the x and y coordinates in their own columns in the CDS with the pixel data, and also update the coordinates for each image you stream, to tell it where to go, with different coordinates for each image.

1 Like

It works setting the x position of each image.
Thank you very much.

1 Like