Problems rendering heatmaps

Hi everyone,
I have been trying Bokeh for a couple days to produce a web dashboard.
What i need to render is not very complex, just a few line graphs and heatmaps. The problem I’m facing is a strange render behaviour when rendering heatmaps with different browser window sizes.

I made a simple test to reproduce the problem:

#Entry point, just a trivial Flask app.

@app.route(’/single’)

def route_home():

script_1, plot_1 = heatmaps.bug_heatmap()

script_2, plot_2 = heatmaps.bug_heatmap2()

return render_template(‘dash_single.html’, plot_1=plot_1, script_1=script_1, plot_2=plot_2, script_2=script_2)

if name == “main”:

“”"

Application Entry Point

“”"

app.run(debug=True, host=‘0.0.0.0’, port=8001)

``

The two functions that produce two heatmaps are the following:

def bug_heatmap():

TOOLS = "hover"

x_range = ['A','B','C','D','E','F','G','H','I','J','K']

y_range = ['X']

p = figure(title='Bugged Heatmap', x_range=x_range, y_range=y_range, x_axis_location="below", toolbar_location="left", responsive=True, tools=TOOLS)


p.plot_height = 150    

p.grid.grid_line_color = None

p.axis.axis_line_color = None

p.axis.major_tick_line_color = None

p.axis.major_label_text_font_size = "9pt"

p.axis.major_label_standoff = 0

p.toolbar.logo = None

p.toolbar_location = None


values = np.random.random(len(x_range))

color = ['#EEEEEE']*len(x_range)


source = ColumnDataSource(

    data=dict(x=x_range, y=['X']*len(x_range), color=color, value=values)

)

p.rect("x", "y", .95, .95, source=source,

       color="color", line_color=None)


p.select_one(HoverTool).tooltips = [

    ('val', '@value'),

]


return components(p)

def bug_heatmap2():

TOOLS = "hover"

x_range = ['A','B','C','D','E','F','G','H','I','J','K','L']

y_range = ['W','X','Y','Z']

p = figure(title='Bugged Heatmap', x_range=x_range, y_range=y_range, x_axis_location="below", toolbar_location="left", responsive=True, tools=TOOLS)    

p.plot_height = 600    

p.grid.grid_line_color = None

p.axis.axis_line_color = None

p.axis.major_tick_line_color = None

p.axis.major_label_text_font_size = "9pt"

p.axis.major_label_standoff = 0

p.toolbar.logo = None

p.toolbar_location = None


x_coord = list()

y_coord = list()

for x in x_range:

    for y in y_range:

        x_coord.append(x)

        y_coord.append(y)

values = np.random.random(len(x_coord))

color = ['#' + ("%0.2X"%(int(v*255)))*3 for v in values]


source = ColumnDataSource(

    data=dict(x=x_coord, y=y_coord, color=color, value=values)

)

p.rect("x", "y", 1, 1, source=source,

       color="color", line_color=None)


p.select_one(HoverTool).tooltips = [

    ('val', '@value'),

]


return components(p)

``

The i have the template:

{{ title }}
<script src="http://cdn.pydata.org/bokeh/release/bokeh-widgets-0.12.9.min.js"></script>

<style>

	div.half_page{

		width: 50%;

	}

</style>
<div class='half_page'>

	{{ script_1|safe }}

	{{ plot_1|safe }}

</div>

<div class='half_page'>

	{{ script_2|safe }}

	{{ plot_2|safe }}

</div>

``

That’s all.

The problem now:

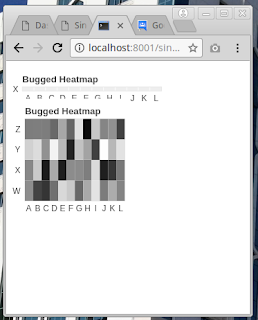
  1. when I load or refresh the page I get this:

As you can see, the two hashmaps are not sized accordingly to browser frame.

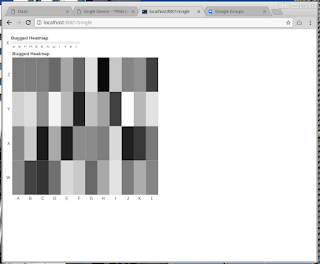
  1. When I resize the browser window, immediately the graphs get their correct size (50% width div):

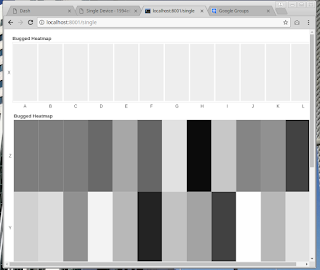
  1. When I resize the browser window to very small values, the two heatmaps resize in different ways:

You see the smallest heatmap has something strage, since its X-axis does not resize as the second heatmap.

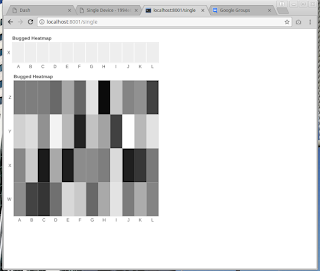
  1. When I resize back to original browser window size, the first heatmap does not “recover” and looks stucked.

To get the first heatmap back again I have to refresh the page, going back to step 1).

Other info:

Bug both on Chrome and Firefox (latest versions)

Linux (Ubuntu)

Thank you for your help!
Hi,

There are almost certainly still bugs with non-fixed layouts in some scenarios. Unfortunately, we are currently under-resourced, and the people who are available don't really have the most relevant experience, for addressing these issues. The project could sorely use a front end contributor, experienced in responsive and mobile UI design, to help. In the immediate term, all I can suggest is to put this detailed information in a GitHub bug report issue so that we can try to prioritize further investigation in the near future.

Thanks,

Bryan

···

On Sep 29, 2017, at 08:43, luca.demo via Bokeh Discussion - Public <[email protected]> wrote:

Hi everyone,
I have been trying Bokeh for a couple days to produce a web dashboard.
What i need to render is not very complex, just a few line graphs and heatmaps. The problem I'm facing is a strange render behaviour when rendering heatmaps with different browser window sizes.

I made a simple test to reproduce the problem:

#Entry point, just a trivial Flask app.

@app.route('/single')
def route_home():
    script_1, plot_1 = heatmaps.bug_heatmap()
    script_2, plot_2 = heatmaps.bug_heatmap2()
    return render_template('dash_single.html', plot_1=plot_1, script_1=script_1, plot_2=plot_2, script_2=script_2)

if __name__ == "__main__":
    """
        Application Entry Point
    """
    app.run(debug=True, host='0.0.0.0', port=8001)

The two functions that produce two heatmaps are the following:
def bug_heatmap():
    TOOLS = "hover"
    x_range = ['A','B','C','D','E','F','G','H','I','J','K']
    y_range = ['X']
    p = figure(title='Bugged Heatmap', x_range=x_range, y_range=y_range, x_axis_location="below", toolbar_location="left", responsive=True, tools=TOOLS)
    
    p.plot_height = 150
    p.grid.grid_line_color = None
    p.axis.axis_line_color = None
    p.axis.major_tick_line_color = None
    p.axis.major_label_text_font_size = "9pt"
    p.axis.major_label_standoff = 0
    p.toolbar.logo = None
    p.toolbar_location = None
    
    values = np.random.random(len(x_range))
    color = ['#EEEEEE']*len(x_range)
    
    source = ColumnDataSource(
        data=dict(x=x_range, y=['X']*len(x_range), color=color, value=values)
    )
    p.rect("x", "y", .95, .95, source=source,
           color="color", line_color=None)
    
    p.select_one(HoverTool).tooltips = [
        ('val', '@value'),
    ]
    
    return components(p)

def bug_heatmap2():
    TOOLS = "hover"
    x_range = ['A','B','C','D','E','F','G','H','I','J','K','L']
    y_range = ['W','X','Y','Z']
    p = figure(title='Bugged Heatmap', x_range=x_range, y_range=y_range, x_axis_location="below", toolbar_location="left", responsive=True, tools=TOOLS)

    p.plot_height = 600
    p.grid.grid_line_color = None
    p.axis.axis_line_color = None
    p.axis.major_tick_line_color = None
    p.axis.major_label_text_font_size = "9pt"
    p.axis.major_label_standoff = 0
    p.toolbar.logo = None
    p.toolbar_location = None
        
    x_coord = list()
    y_coord = list()
    for x in x_range:
        for y in y_range:
            x_coord.append(x)
            y_coord.append(y)

    values = np.random.random(len(x_coord))
    color = ['#' + ("%0.2X"%(int(v*255)))*3 for v in values]
    
    source = ColumnDataSource(
        data=dict(x=x_coord, y=y_coord, color=color, value=values)
    )
    p.rect("x", "y", 1, 1, source=source,
           color="color", line_color=None)
    
    p.select_one(HoverTool).tooltips = [
        ('val', '@value'),
    ]
    
    return components(p)

The i have the template:
<!DOCTYPE html>
<html>
  <head>
    <title>{{ title }}</title>
    <link href="http://cdn.pydata.org/bokeh/release/bokeh-0.12.9.min.css&quot; rel="stylesheet">
    <link href="http://cdn.pydata.org/bokeh/release/bokeh-widgets-0.12.9.min.css&quot; rel="stylesheet">
    <script src="http://cdn.pydata.org/bokeh/release/bokeh-0.12.9.min.js&quot;&gt;&lt;/script&gt;
  <script src="http://cdn.pydata.org/bokeh/release/bokeh-widgets-0.12.9.min.js&quot;&gt;&lt;/script&gt;
  <style>
    div.half_page{
      width: 50%;
    }
  </style>
  </head>
  <body>
  <div class='half_page'>
    {{ script_1|safe }}
    {{ plot_1|safe }}
  </div>
  <div class='half_page'>
    {{ script_2|safe }}
    {{ plot_2|safe }}
  </div>
  </body>
</html>

That's all.
The problem now:

1) when I load or refresh the page I get this:

As you can see, the two hashmaps are not sized accordingly to browser frame.
2) When I resize the browser window, immediately the graphs get their correct size (50% width div):

3) When I resize the browser window to very small values, the two heatmaps resize in different ways:

You see the smallest heatmap has something strage, since its X-axis does not resize as the second heatmap.
4) When I resize back to original browser window size, the first heatmap does not "recover" and looks stucked.

To get the first heatmap back again I have to refresh the page, going back to step 1).

Other info:
Bug both on Chrome and Firefox (latest versions)
Linux (Ubuntu)

Thank you for your help!
--
You received this message because you are subscribed to the Google Groups "Bokeh Discussion - Public" group.
To unsubscribe from this group and stop receiving emails from it, send an email to [email protected].
To post to this group, send email to [email protected].
To view this discussion on the web visit https://groups.google.com/a/continuum.io/d/msgid/bokeh/bce9b7e1-6d3a-48bd-9a13-404e7dc7206b%40continuum.io\.
For more options, visit https://groups.google.com/a/continuum.io/d/optout\.