I am trying to make a standalone html where the user can choose what categories will be used by the x and y axis. I found it fairly easy to change the values for the y-axis. However, changing the order / values for the x-axis is proving tricky.
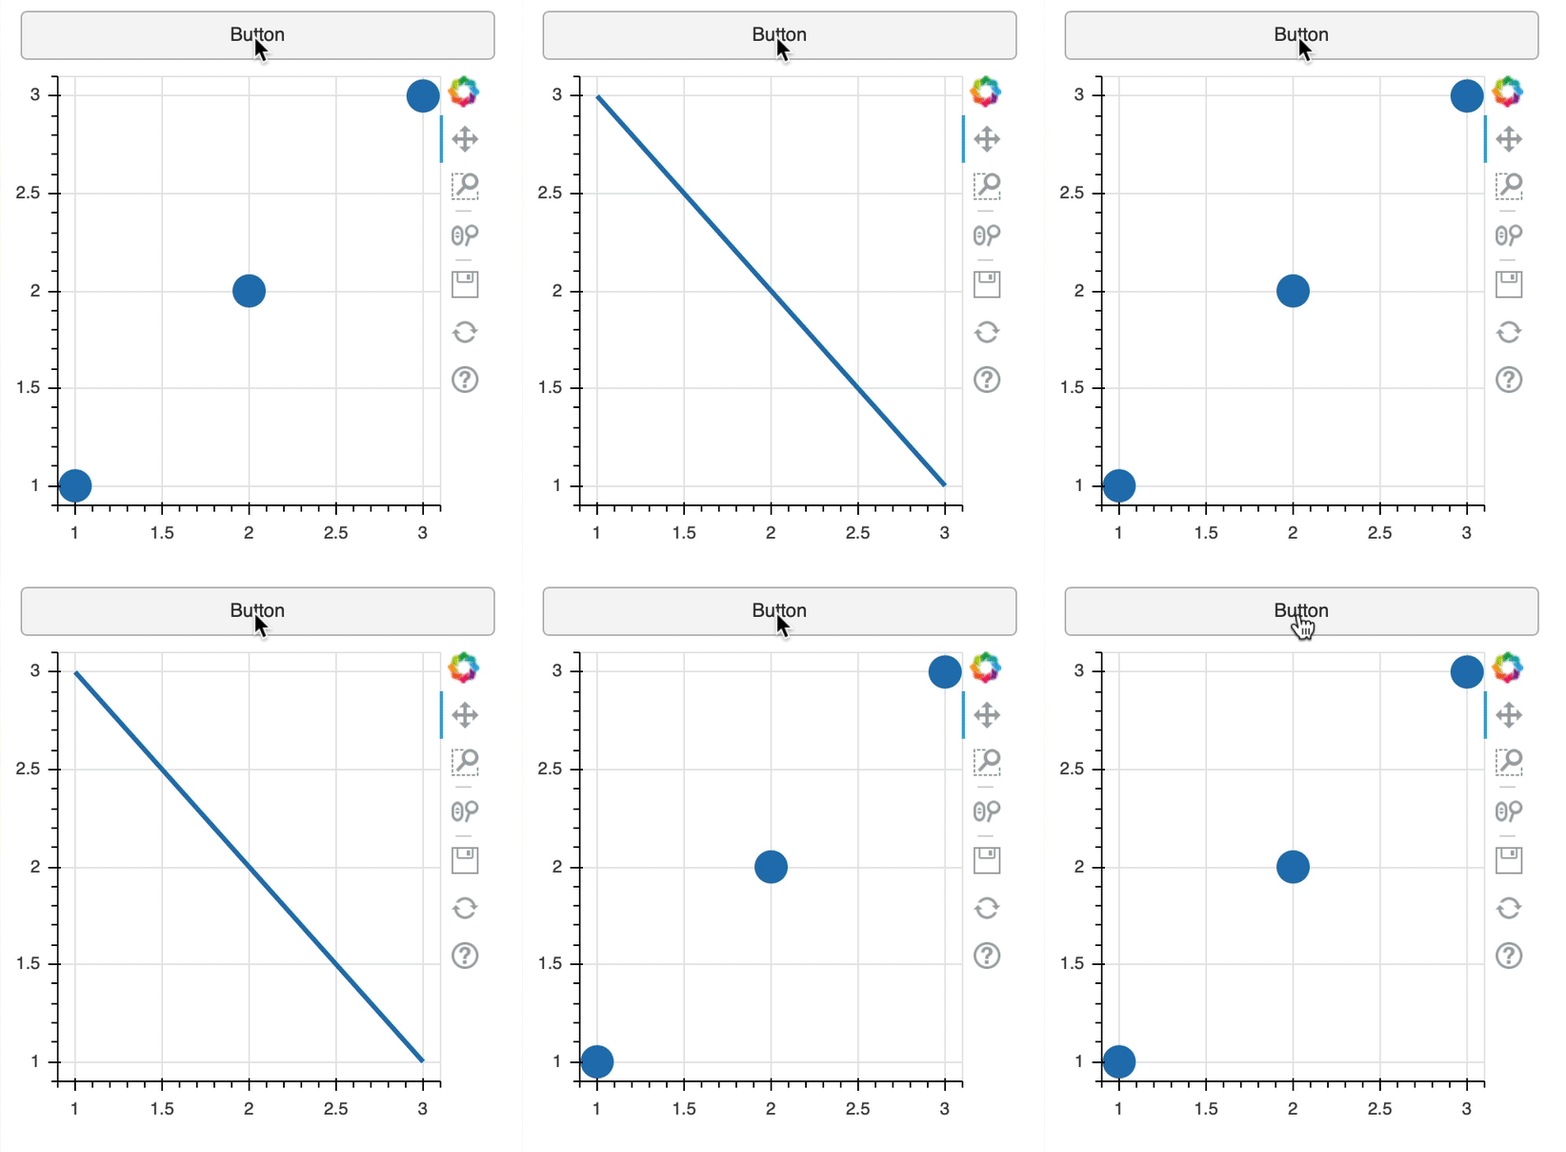
As an experiment I used a pair of 3 nested factors, but actually only varied one of them, and they show properly as two separate bars. However, when I use the below code to reverse the order of the factors, I get the below blank graph with odd garbage in the upper right.
How should I be doing this?
forward = test_source.data.x;
                x_length = forward.length;

                var i;
                for (i = 0; i < x_length; i++) {
                    var temp = [3];
                    var k;
                    for(k=0;k<forward[i].length;k++) {
                        temp[k] = forward[i][k];
                    }

                    for (j = 0; j < 3; j++) {
                        forward[i][j] = temp[2-j];
                    }
                }
                p.x_range=FactorRange(factors=forward);
                test_source.change.emit();