☰Read-only archive⌕
Looking for help with Bokeh?

This is a read-only archive. Ask questions and join the conversation on GitHub.

Visit Community Support on GitHub →
Archived discussions · Captured October 28, 2026

Providing data for a multi line from a dataframe? Having trouble figuring out how to restructure the dataframe / use multi_line's syntax

Community Support
tvkyq
tvkyq

I’ve got a big dataframe called dataset which kinda looks like this:

Year New_ID Peak_change
1980 1 1
1980 2 0.985478
1980 3 0.974417
1990 1 1
1990 2 0.996124
1990 3 0.98718
1990 4 0.990161
1990 5 0.980106
2000 1 1
2000 2 0.985065
2000 3 0.984873
2000 4 0.978173

And I’m trying to create a line graph which looks like the output from this stackoverflow question. I’ve tried this:

from bokeh.plotting import figure, output_file, show
output_file(‘index.html’)
p = figure(
title =‘Simple’)
p.line(x= dataset.New_ID, y= dataset.Peak_change, legend_label= ‘Year’)
show(p)

But it isn’t being split up into different lines based off legend_label in the way circle plots seem to automatically work out. It seems I need a multi line graph, but I don’t understand how to provide the data using the syntax demonstrated here. Is it possible to set this up in some kind of for loop?

⌁   Link to post
p-himik
p-himik

MultiLine is a single glyph. If you want each line to have a separate legend item, you will have to use the regular Line glyph multiple times:

from io import StringIO

import pandas as pd
from bokeh.plotting import figure, show

df = pd.read_csv(StringIO("""Year	New_ID	Peak_change
1980	1	1
1980	2	0.985478
1980	3	0.974417
1990	1	1
1990	2	0.996124
1990	3	0.98718
1990	4	0.990161
1990	5	0.980106
2000	1	1
2000	2	0.985065
2000	3	0.984873
2000	4	0.978173"""), sep='\t')

p = figure(title='Simple')
for name, group in df.groupby('Year'):
    p.line(x=group.New_ID, y=group.Peak_change, legend_label=str(name))

show(p)
⌁   Link to post
tvkyq
tvkyq

Thank you!! This works beautifully!

If I could bother you on a slightly different topic, I’m now stuck on trying to assign different colors to the lines but I don’t understand how to integrate that into this for loop… I’ve tried to adapt the code from this example:

for name, group, i in dataset.groupby('Year'), Spectral11:
    p.line(x=group.New_ID, y=group.Peak_change, legend_label= str(name), color= Spectral11[i])

But for reasons probably obvious to you that didn’t work. Any ideas?

⌁   Link to post
p-himik
p-himik

Given the example that you link (I didn’t check the code):

for (name, group), color in zip(dataset.groupby('Year'), Spectral11):
    p.line(x=group.New_ID, y=group.Peak_change, legend_label=str(name), color=color)

Note that this will display up to 11 lines because Spectral11 has only 11 colors. If you need more lines, some other palette or coloring scheme should be used.

⌁   Link to post
tvkyq
tvkyq

OK great I think that’s nearly there but it didn’t quite work. I’ve tried this, with Category20:

for (name, group), color in zip(dataset.groupby(‘Year’), Category20):
p.line(x=group.New_ID, y=group.Peak_change, legend_label= str(name), color=color)

The error message it throws is ValueError: expected an element of either Enum('aliceblue', 'antiquewhite', 'aqua', 'aquamarine', ... going on for maybe 100 colors. I don’t know what Enum means but could it be expecting some kinda string?

⌁   Link to post
Carl
Carl

Hopefully this isn’t straying to far from the path, I too was struggling with this where I wanted to plot multiple columns in a pandas dataframe I had. The dataframe consisted of a Date column (my x-axis value) and Water / Oil columns. The below code is slight variation of what has already been posted above, just wanted to share simple example of what I have working. The main point was to ensure the Date column was in correct datetime format and adding x_axis_type=“datetime” to the figure.


p = figure(sizing_mode="scale_width", plot_height=85,x_axis_type="datetime")

for column_name, spectral_color in zip(['Water','Oil'], Spectral10):
        p.scatter(x=df['Date'], y=df[column_name], size=1.3, color=spectral_color, alpha=0.8, 
                 legend_label=column_name)
⌁   Link to post
tvkyq
tvkyq

Hey @p-himik might be starting to digress here but tooltips don’t seem to be working, probably because of how we’ve brought in the lines with the for loop and df.groupby. It renders but all the values are ‘???’. I hoped this would work:

ttips = HoverTool(tooltips = [
    ("Peak Change", "@{Peak_change}")])
p = figure(title ='whatever')
p.add_tools(ttips)

But no dice. I’ve tried to enter tooltips within the for loop but that doesn’t seem to work as p.line won’t accept tooltips as an argument.

I’ve had a look around on other posts and stackoverflow but I only found posts that are obsolete or involved workarounds for slightly different things I didn’t understand.

Any ideas?

@Carl cool to see others trying to figure out the same thing!

⌁   Link to post
p-himik
p-himik

Carl is correct. By using @{Peak_change} (BTW {} are not necessary here, I think), you’re asking the tooltip to look up this value in the data source of the renderer that you hover over. Your renderers don’t have any data source attached since you just provide the data directly.
Start providing the data via data sources, and make sure they have Peak_change column - the tooltip will work then.

⌁   Link to post
tvkyq
tvkyq

Ah, not shown in the code I’ve supplied is a line I’ve since added, source = ColumnDataSource(dataset). Perhaps I could’ve better explained how I’m stuck. My issue is that I don’t know to assign source to the line renderers.

If I drop source=source into the for loop it throws the error message, ‘Expected x and y to reference fields in the supplied data source’, so I’m now unsure what to do.

⌁   Link to post
p-himik
p-himik

An analog of what you do:

x = [1, 2, 3]
y = [2, 3, 4]
source = ColumnDataSource(data=dict(x=x, y=y))
plot.line(x=x, y=y, source=source)

Now compare it what should be done instead:

source=ColumnDataSource(data=dict(x=[1, 2, 3], y=[2, 3, 4]))
plot.line(x='x', y='y', source=source)

Notice how I pass strings that reference columns within the source instead of passing the data directly.

If you think the error message could be improved, let us know.

⌁   Link to post
tvkyq
tvkyq

Hey @p-himik I’m sorry but I’m kinda new to programming and don’t understand how

source=ColumnDataSource(data=dict(x=[1, 2, 3], y=[2, 3, 4]))
plot.line(x='x', y='y', source=source)

could be applied to the dataframe I’m using that’s thousands of rows long with the .groupby('Year') for loop you’ve helped me set up.

Isn’t

x = [1, 2, 3]
y = [2, 3, 4]
source = ColumnDataSource(data=dict(x=x, y=y))

the same as

source=ColumnDataSource(data=dict(x=[1, 2, 3], y=[2, 3, 4]))

this? You’ve just haven’t specified x and y separately, right?

Thanks for being patient with me…

⌁   Link to post
p-himik
p-himik

Since none of the glyphs share any data, you have to create a separate data source for each glyph. Just put source = ... in the loop body and use it:

for (name, group), color in zip(dataset.groupby('Year'), Spectral11):
    source = ColumnDataSource(group)
    p.line(x='New_ID', y='Peak_change', source=source, legend_label=str(name), color=color)
⌁   Link to post
tvkyq
tvkyq

I’m sorry man but I still can’t get this to work. I’m still getting the same error message as before. I feel like an idiot. Here’s all the relevant code:

ttips = HoverTool(tooltips=[
    ("Peak Change", "@Peak_change")])
p = figure(title ='whatever')

for (name, group), color in zip(dataset.groupby('Year'), Category20_20):
    source = ColumnDataSource(group)
    p.line(x=group.New_ID, y=group.Peak_change, legend_label=str(name),
           source=source)

p.add_tools(ttips)

Are you sure source = ColumnDataSource(group) is correct? Earlier I had it ahead of the for loop as source = ColunDataSource(dataset), as dataset is the name of the dataframe. I also tried source = ColumnDataSource(dataset.groupby(group)) in the for loop but that didn’t work either.

⌁   Link to post
p-himik
p-himik

This is my line:

p.line(x='New_ID', y='Peak_change', source=source, legend_label=str(name), color=color)

And this is yours:

p.line(x=group.New_ID, y=group.Peak_change, legend_label=str(name),
       source=source)

Apart from the order of the arguments (which doesn’t matter), do you see any difference?

⌁   Link to post
tvkyq
tvkyq

Hey @p-himik I’m sorry to bring this up again as you’re probably sick of me and I’ve already made enough of a fool of myself. I’m trying to adapt the logic used to create these lines with ColumnDataSource and I can’t figure out where I’m going wrong.

I have a heatmap you might recognize and the values are controlled by a slider, and I’d like this same controlled data to be shown as lines. I think the issue might be caused by source = ColumnDataSource(column) - can CDS be supplied with whatever you’re trying to create a group / subset of in this way?

from pandas import *
from bokeh.io import show
from bokeh.layouts import column
from bokeh.models import LinearColorMapper, CustomJS, Slider, ColumnDataSource
from bokeh.palettes import Viridis256
from bokeh.plotting import figure

df = DataFrame({'attribute': ['Y', 'Y', 'Y', 'Y', 'Z', 'Z', 'Z', 'Z']
                   , 'period': [1, 2, 3, 4, 1, 2, 3, 4]
                   , '1': [1, 37, 44, 13, 41, 51, 18, 14]
                   , '2': [10, 3, 44, 53, 20, 9, 18, 14]
                   , '3': [80, 37, 22, 13, 13, 44, 18, 14]})

df['period'] = df['period'].astype(str)
periods = df.period.unique().tolist()
attributes = df.attribute.unique().tolist()
selectable_columns = ['1', '2', '3']

source=ColumnDataSource(df)

active = 1
values_select = Slider(title="Values", start=1, end=3, step=1, value=active)
color_mapper = LinearColorMapper(palette=Viridis256, low=df[str(active)].min(), high=df[str(active)].max())
heatmap_fig = figure(x_range=periods, y_range=attributes)
renderer = heatmap_fig.rect(x="period", y="attribute", width=1, height=1, line_color=None, source=source, name=str(active),
                            fill_color={'field': str(active), 'transform': color_mapper})

line_fig = figure()

for column in selectable_columns:
    source = ColumnDataSource(column)
    line_fig.line(x='period'
            , y='attribute'
            , legend_label=str(column)
            , source=source)

values_select.js_on_change('value', CustomJS(args=dict(renderer=renderer, heatmap_fig=heatmap_fig, line_fig=line_fig), code="""\
    const active = cb_obj.value.toString();
    const data = renderer.data_source.data[active];
    renderer.name = active;
    const {transform} = renderer.glyph.fill_color;
    renderer.glyph.fill_color = {field: cb_obj.value, transform: transform};
    heatmap_fig.reset.emit()
    line_fig.reset.emit()
"""))

show(column(values_select, heatmap_fig, line_fig))

The error says it expects a dict or pandas.df … but how else could I supply the data?

⌁   Link to post
_jm
_jm

Hi @tvkyq

In the for-loop, you are iterating over selectable_columns which is a list of integers. The error occurs on the first iteration at first line of that loop because you are attempting to make a ColumnDataSource out of the current iterator value, '1'.

for column in selectable_columns:
    source = ColumnDataSource(column)

Another quick observation is to not reuse the name column for your loop variable as it shadows the bokeh column model that you’ve imported with the same name.

from bokeh.layouts import column

I hope this helps and someone with more context of what you want to actually include in the line plot can answer the actual question you are about.

⌁   Link to post
tvkyq
tvkyq

The error occurs on the first iteration at first line of that loop because you are attempting to make a ColumnDataSource out of the current iterator value, '1 '.

Ok, but this is what I intended, and I don’t understand why this causes an error. The names of columns are strings of numbers, and this is so the selected data can be controlled by the slider. Does this itself cause problems or have I missed something?

Thanks for the tip on naming the column variable. I’ll change that now.

⌁   Link to post
p-himik
p-himik

You provide intelligible descriptions and examples, so no need to be sorry. :slight_smile:

Regarding your question - I’m not sure what you want. In the code, you’re plotting a line of attribute by period, which don’t depend upon any of the selectable_columns.
Do you want to end up with 6 lines, Y1, Y2, Y3, Z1, Z2, Z3?

⌁   Link to post
tvkyq
tvkyq

You provide intelligible descriptions and examples

In a sudden twist I’ve realised I’ve provided a terrible example: I’ve provided data that’s easily confused and I haven’t accurately described what I’m trying to do.

The heatmap works as intended, and I’m trying to show this same data on a line graph to be affected by the same slider.

For the line graph:

  • lines: different lines for each attribute
  • y axis: the values of whichever column of ‘1’, ‘2’, and ‘3’ is selected. Note these column names were previously easily confused with period values.
  • x axis: period values.

Updated code which still doesn’t work in the way I hoped it would:

from pandas import *
from bokeh.io import show
from bokeh.layouts import column
from bokeh.models import LinearColorMapper, CustomJS, Slider, ColumnDataSource
from bokeh.palettes import Viridis256
from bokeh.plotting import figure

df = DataFrame({'attribute': ['Y', 'Y', 'Y', 'Y', 'Z', 'Z', 'Z', 'Z']
                   , 'period': [100, 200, 300, 400, 100, 200, 300, 400]
                   , '1': [1, 37, 44, 13, 41, 51, 18, 14]
                   , '2': [10, 3, 44, 53, 20, 9, 18, 14]
                   , '3': [80, 37, 22, 13, 13, 44, 18, 14]})

df['period'] = df['period'].astype(str)
periods = df.period.unique().tolist()
attributes = df.attribute.unique().tolist()
selectable_columns = ['1', '2', '3']

source=ColumnDataSource(df)

active = 1
values_select = Slider(title="Values", start=1, end=3, step=1, value=active)
color_mapper = LinearColorMapper(palette=Viridis256, low=df[str(active)].min(), high=df[str(active)].max())
heatmap_fig = figure(x_range=periods, y_range=attributes)
renderer = heatmap_fig.rect(x="period", y="attribute", width=1, height=1, line_color=None, source=source, name=str(active),
                            fill_color={'field': str(active), 'transform': color_mapper})

line_fig = figure()

for a in attributes:
    source = ColumnDataSource(a)
    line_fig.line(x='period'
            , y=str(a)
            , legend_label=str(a)
            , source=source)

values_select.js_on_change('value', CustomJS(args=dict(renderer=renderer, heatmap_fig=heatmap_fig, line_fig=line_fig), code="""\
    const active = cb_obj.value.toString();
    const data = renderer.data_source.data[active];
    renderer.name = active;
    const {transform} = renderer.glyph.fill_color;
    renderer.glyph.fill_color = {field: cb_obj.value, transform: transform};
    heatmap_fig.reset.emit()
    line_fig.reset.emit()
"""))

show(column(values_select, heatmap_fig, line_fig))
⌁   Link to post
p-himik
p-himik

Gotcha. No need to create new data sources, you just have to filter the values. One issue - you will get a warning: “CDSView filters are not compatible with glyphs with connected topology such as Line or Patch”. But in your case, you can just ignore it.

from pandas import *
from bokeh.io import show
from bokeh.layouts import column
from bokeh.models import LinearColorMapper, CustomJS, Slider, ColumnDataSource, CDSView, GroupFilter
from bokeh.palettes import Viridis256
from bokeh.plotting import figure

df = DataFrame({'attribute': ['Y', 'Y', 'Y', 'Y', 'Z', 'Z', 'Z', 'Z']
                   , 'period': [100, 200, 300, 400, 100, 200, 300, 400]
                   , '1': [1, 37, 44, 13, 41, 51, 18, 14]
                   , '2': [10, 3, 44, 53, 20, 9, 18, 14]
                   , '3': [80, 37, 22, 13, 13, 44, 18, 14]})

df['period'] = df['period'].astype(str)
periods = df.period.unique().tolist()
attributes = df.attribute.unique().tolist()
selectable_columns = ['1', '2', '3']

source = ColumnDataSource(df)

active = 1
values_select = Slider(title="Values", start=1, end=3, step=1, value=active)
color_mapper = LinearColorMapper(palette=Viridis256, low=df[str(active)].min(), high=df[str(active)].max())
heatmap_fig = figure(x_range=periods, y_range=attributes)
heatmap_renderer = heatmap_fig.rect(x="period", y="attribute", width=1, height=1, line_color=None, source=source,
                                    name=str(active),
                                    fill_color={'field': str(active), 'transform': color_mapper})

line_fig = figure()

line_renderers = []
for a in attributes:
    r = line_fig.line(x='period'
                      , y=str(active)
                      , legend_label=str(a)
                      , view=CDSView(source=source,
                                     filters=[GroupFilter(column_name='attribute',
                                                          group=a)])
                      , source=source)
    line_renderers.append(r)

values_select.js_on_change('value',
                           CustomJS(args=dict(heatmap_renderer=heatmap_renderer,
                                              line_renderers=line_renderers,
                                              heatmap_fig=heatmap_fig, line_fig=line_fig), code="""\
    const active = cb_obj.value.toString();
    const data = heatmap_renderer.data_source.data[active];
    heatmap_renderer.name = active;
    const {transform} = heatmap_renderer.glyph.fill_color;
    heatmap_renderer.glyph.fill_color = {field: cb_obj.value, transform: transform};
    heatmap_fig.reset.emit();
    
    for (const lr of line_renderers) {
        lr.glyph.y = {field: active};
    }
    line_fig.reset.emit();
"""))

show(column(values_select, heatmap_fig, line_fig))
⌁   Link to post
tvkyq
tvkyq

Alright so I’ve had a good play around trying to figure out what you’ve done and although your example works despite errors I don’t understand I think there are two more issues in implementing this in the file I’m working with:

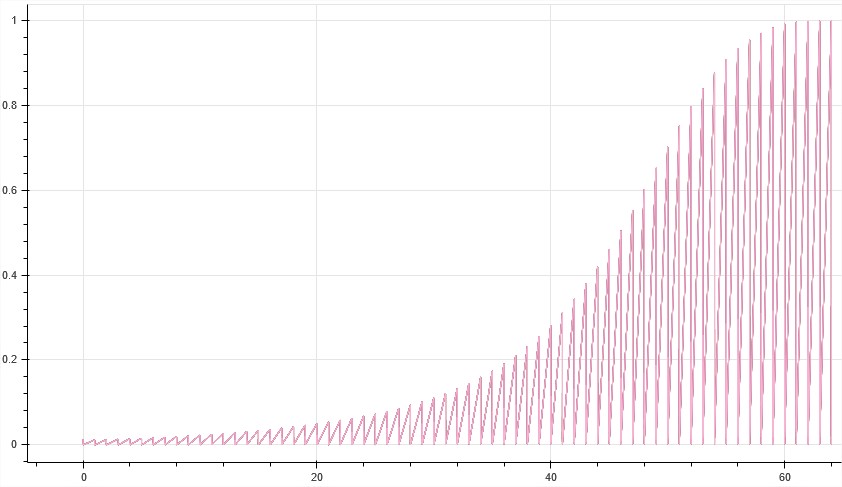
  • the lines aren’t rendering properly and I can’t figure out why. They don’t seem to be showing in separate lines, zig zag together, and instead all show as the line of the last color:

Many of the lines for the line fig have NaN values in higher active values, and these lines usually end in NaN values. This is intentional as these values can’t logically exist. Perhaps this is causing the problem?

  • the data is also filtered by a CustomJSFilter, which so the data is subject to a view, which these warnings you said I can ignore say aren’t compatible with. Have already checked this isn’t causing the immediate problem of lines not rendering properly but is there some way I can get around this?
⌁   Link to post
tvkyq
tvkyq

Ah… you know, I’ve since noticed I didn’t set GroupFilter(column_name='cause_label' to the correct ‘cause_label’. But that has uncovered another issue: nothing renders at all in the line graph anymore.

I’ve worked and worked with this thing and can’t work out what I’m doing wrong. I’m going crazy lol. Here’s the file I’m working with cut down as much as I could:

import pandas as pd
from bokeh.models import LinearColorMapper, ColumnDataSource, Slider, Select, CustomJSFilter, CDSView, CustomJS, GroupFilter
from bokeh.layouts import row, column, layout
from bokeh.plotting import figure, output_file, show
from bokeh.palettes import Viridis256, Category20_20

df = pd.read_excel('heatmap_linegraph_datademo.xlsx', index_col=0)
df = df.reset_index()

df = df.rename(columns={n: str(n) for n in range(1,11)})

output_file('heatmap_linegraph.html', title='whatever', mode='inline')

df['period'] = df['period'].astype(str)
periods = df.period.unique().tolist()
causes = df.option.unique().tolist()
df['active_column'] = df['5']

source = ColumnDataSource(data=df)

active = 5
color_mapper = LinearColorMapper(palette=Viridis256,
                                 low=0,
                                 high=0.02)

year_select = Slider(value=active, start=1, end=10, step=1)
ability_select = Select(value='noob', options=['l33t', 'noob'])

ability_filter = CustomJSFilter(args=dict(ability_select=ability_select), code='''
    var indices = []
    for (var i = 0; i < source.get_length(); i++){
        if (source.data['ability'][i] == ability_select.value){
                indices.push(true);
            } else {
                indices.push(false);
            }
        }
        return indices;
''')

view = CDSView(source=source, filters=[ability_filter])
heatmap = figure(x_range=periods, y_range=causes,
                 x_axis_location="above", sizing_mode="stretch_both")

heatmap_renderer = heatmap.rect(x="period", y="option", width=1, height=0.95,
                                source=source, view=view,
                                fill_color={'field': str(active), 'transform': color_mapper},
                                line_color=None, name=str(active))
line_fig = figure(sizing_mode="stretch_both")
line_renderers = []
for cause, color in zip(causes, Category20_20):
    r = line_fig.line(x='period'
                      ,y=str(active)
                      ,source=source
                      ,legend_label=str(cause)
                      ,view=CDSView(source=source,
                                    filters=[GroupFilter(column_name='option',
                                                         group=cause)]))
    line_renderers.append(r)

ability_select.js_on_change('value', CustomJS(args=dict(source=source, year_select=year_select, ability_select=ability_select), code="""
   source.change.emit()
"""))

year_select.js_on_change('value', CustomJS(args=dict(heatmap_renderer=heatmap_renderer, p=heatmap, year_select=year_select, source=source, ability_select=ability_select, line_fig=line_fig, line_renderers=line_renderers), code="""\
    const active = cb_obj.value;
    const data = heatmap_renderer.data_source.data[active];
    heatmap_renderer.name = String(active);
    const {transform} = heatmap_renderer.glyph.fill_color;
    heatmap_renderer.glyph.fill_color = {field: cb_obj.value, transform: transform};
    for (const lr of line_renderers) {
    lr.glyph.y = {field: active};
    }    
    source.data['active_column'] = source.data[year_select.value]
    source.change.emit()
"""))

top_area = row(year_select, ability_select)
show(layout(column([top_area, heatmap, line_fig]), sizing_mode="stretch_both"))

And I can’t upload the demo xlsx so here’s a link to where I’ve put it on AWS.

Any idea what I’m doing wrong? Thanks again for the help dude…

⌁   Link to post
tvkyq
tvkyq

That’s strange… Is that the error the link gives? I’ve just tried on another device and it’s accesses it ok. Maybe I didn’t initially set it to public. Could you please try again?

Also, that demo data should have N/A (for excel) or np.NaN (for Python) values for many values that have higher period values, and that’s not shown in the demo data. Probably wouldn’t matter but should mention just in case.

Thanks again

⌁   Link to post
p-himik
p-himik

Ah, sorry - I was half asleep there and completely missed the link, so I thought that you just replaced the test data with a real one and forgot to replace it back.
I’ll take a look today. BTW, you can pass links directly to pd.read_excel, I think. At least, it works with pd.read_csv. Of course, it’s only good for examples since Pandas doesn’t cache anything.

⌁   Link to post
tvkyq
tvkyq

Oh yeah good point you can pass the url directly into the code! Here’s the code updated with direct url link to xlsx with the NaN values. Thanks again dude

import pandas as pd
from bokeh.models import LinearColorMapper, ColumnDataSource, Slider, Select, CustomJSFilter, CDSView, CustomJS, GroupFilter
from bokeh.layouts import row, column, layout
from bokeh.plotting import figure, output_file, show
from bokeh.palettes import Viridis256, Category20_20

df = pd.read_excel('https://cjdixon.s3-ap-southeast-2.amazonaws.com/bokeh/heatmap_linegraph_datademo.xlsx', index_col=0)
df = df.reset_index()

df = df.rename(columns={n: str(n) for n in range(1,11)})

output_file('heatmap_linegraph.html', title='whatever', mode='inline')

df['period'] = df['period'].astype(str)
periods = df.period.unique().tolist()
causes = df.option.unique().tolist()
df['active_column'] = df['5']

source = ColumnDataSource(data=df)

active = 5
color_mapper = LinearColorMapper(palette=Viridis256,
                                 low=0,
                                 high=0.02)

year_select = Slider(value=active, start=1, end=10, step=1)
ability_select = Select(value='noob', options=['l33t', 'noob'])

ability_filter = CustomJSFilter(args=dict(ability_select=ability_select), code='''
    var indices = []
    for (var i = 0; i < source.get_length(); i++){
        if (source.data['ability'][i] == ability_select.value){
                indices.push(true);
            } else {
                indices.push(false);
            }
        }
        return indices;
''')

view = CDSView(source=source, filters=[ability_filter])
heatmap = figure(x_range=periods, y_range=causes,
                 x_axis_location="above", sizing_mode="stretch_both")

heatmap_renderer = heatmap.rect(x="period", y="option", width=1, height=0.95,
                                source=source, view=view,
                                fill_color={'field': str(active), 'transform': color_mapper},
                                line_color=None, name=str(active))
line_fig = figure(sizing_mode="stretch_both")
line_renderers = []
for cause, color in zip(causes, Category20_20):
    r = line_fig.line(x='period'
                      ,y=str(active)
                      ,source=source
                      ,legend_label=str(cause)
                      ,view=CDSView(source=source,
                                    filters=[GroupFilter(column_name='option',
                                                         group=cause)]))
    line_renderers.append(r)

ability_select.js_on_change('value', CustomJS(args=dict(source=source, year_select=year_select, ability_select=ability_select), code="""
   source.change.emit()
"""))

year_select.js_on_change('value', CustomJS(args=dict(heatmap_renderer=heatmap_renderer, p=heatmap, year_select=year_select, source=source, ability_select=ability_select, line_fig=line_fig, line_renderers=line_renderers), code="""\
    const active = cb_obj.value;
    const data = heatmap_renderer.data_source.data[active];
    heatmap_renderer.name = String(active);
    const {transform} = heatmap_renderer.glyph.fill_color;
    heatmap_renderer.glyph.fill_color = {field: cb_obj.value, transform: transform};
    for (const lr of line_renderers) {
    lr.glyph.y = {field: active};
    }    
    source.data['active_column'] = source.data[year_select.value]
    source.change.emit()
"""))

top_area = row(year_select, ability_select)
show(layout(column([top_area, heatmap, line_fig]), sizing_mode="stretch_both"))
⌁   Link to post
p-himik
p-himik

Things you need to change:

  • Instead of using CDSView with line_fig.line just create a data source with a subset of data
  • Actually pass color=color to line_fig.line
  • If you still can’t get the line plot to work, then write a simpler version of the code in a separate file - for example, your callbacks are bloated and you don’t need the heatmap to test out the lines. It will make it much easier for you to figure out

Regarding zigzagging lines - well, that’s what the data is. You’re plotting the numbered columns by the period column. Each single period value contains multiple values within the same numbered column - it is bound to be a zigzag unless the values are all the same (and they’re not).

⌁   Link to post
tvkyq
tvkyq

Instead of using CDSView with line_fig.line just create a data source with a subset of data

I’m unsure how to do this in the same way this was done for df.groupby('Year') for earlier examples in this thread. As the df is now contained in source = ColumnDataSource(data=df) I don’t know how to get .groupby to work. Could you please point me in the right direction?

  • Actually pass color=color to line_fig.line

Ah yes I removed this in effort to simplify the file. I’ve put it back in.

Regarding zigzagging lines - well, that’s what the data is. You’re plotting the numbered columns by the period column. Each single period value contains multiple values within the same numbered column - it is bound to be a zigzag unless the values are all the same (and they’re not).

Did you notice the ability_filter? Values are also separated by another column, ability, so I don’t think there are multiple values for combinations of period, ability, and option columns. However, this isn’t an issue right now as nothing renders in the line graph at all. lol.

⌁   Link to post
p-himik
p-himik

You don’t need groupby for this. Just add this to the for loop body:

source = ColumnDataSource(df[df.option=cause])

I did. But it doesn’t affect the lines in any way.

Follow the advice I’ve given you earlier - start small with just the broken part, try to build it up from the ground up till it breaks, figure out what’s wrong, and only then start piling up functionality on top of it.

⌁   Link to post
tvkyq
tvkyq

source = ColumnDataSource(df[df.option=cause])

Ooh I didn’t know you could do this! That makes so much sense! Are you sure this syntax is correct though? I’ve tried this and a few variations and it doesn’t seem to like the equals sign but I don’t know why…

⌁   Link to post
tvkyq
tvkyq

Oh yeah! :smiley: Because the single = is a declaration but == is a test for a condition, right? That works perfectly, thank you!


There’s just one last piece I can’t figure out! The data needs to be filtered by the ability_filter, because this seems like it’s causing the jagged lines. I thought view could be used for this but it seems that’ won’t be compatible with line graphs. I’ve also set up & (df.ability == ability_select.value) in the line source which filters it correctly but I can’t get it to update. I’ve included line_fig.reset.emit() in the js_on_change but that hasn’t worked either… any last ideas?

import pandas as pd
from bokeh.models import LinearColorMapper, ColumnDataSource, Slider, Select, CustomJSFilter, CDSView, CustomJS, GroupFilter
from bokeh.layouts import row, column, layout
from bokeh.plotting import figure, output_file, show
from bokeh.palettes import Viridis256, Category20_20

df = pd.read_excel('https://cjdixon.s3-ap-southeast-2.amazonaws.com/bokeh/heatmap_linegraph_datademo.xlsx', index_col=0)
df = df.reset_index()

df = df.rename(columns={n: str(n) for n in range(1,11)})

output_file('heatmap_linegraph.html', title='whatever', mode='inline')

df['period'] = df['period'].astype(str)
periods = df.period.unique().tolist()
causes = df.option.unique().tolist()
abilities = df.ability.unique().tolist()
df['active_column'] = df['5']

source = ColumnDataSource(data=df)

active = 5
color_mapper = LinearColorMapper(palette=Viridis256,
                                 low=0,
                                 high=0.02)

year_select = Slider(value=active, start=1, end=10, step=1)
ability_select = Select(value='noob', options=['l33t', 'noob'])

ability_filter = CustomJSFilter(args=dict(ability_select=ability_select), code='''
    var indices = []
    for (var i = 0; i < source.get_length(); i++){
        if (source.data['ability'][i] == ability_select.value){
                indices.push(true);
            } else {
                indices.push(false);
            }
        }
        return indices;
''')

view = CDSView(source=source, filters=[ability_filter])
heatmap = figure(x_range=periods, y_range=causes,
                 x_axis_location="above", sizing_mode="stretch_both")

heatmap_renderer = heatmap.rect(x="period", y="option", width=1, height=0.95,
                                source=source, view=view,
                                fill_color={'field': str(active), 'transform': color_mapper},
                                line_color=None, name=str(active))
line_fig = figure(sizing_mode="stretch_both", y_range = (0, .03)
, x_range = (0, 60))
line_renderers = []
for cause, color, ability in zip(causes, Category20_20, abilities):
    r = line_fig.line(x='period'
                      ,y=str(active)
                      ,color=color
                      ,line_width=3
                      ,source= ColumnDataSource(data=df[(df.option==cause) & (df.ability == ability_select.value)])
                      ,legend_label=str(cause))
    line_renderers.append(r)

ability_select.js_on_change('value', CustomJS(args=dict(source=source, year_select=year_select, ability_select=ability_select), code="""
   source.change.emit()
"""))

year_select.js_on_change('value', CustomJS(args=dict(heatmap_renderer=heatmap_renderer, p=heatmap, year_select=year_select, source=source, ability_select=ability_select, line_fig=line_fig, line_renderers=line_renderers), code="""\
    const active = cb_obj.value;
    const data = heatmap_renderer.data_source.data[active];
    heatmap_renderer.name = String(active);
    const {transform} = heatmap_renderer.glyph.fill_color;
    heatmap_renderer.glyph.fill_color = {field: cb_obj.value, transform: transform};
    for (const lr of line_renderers) {
    lr.glyph.y = {field: active};
    }    
    source.data['active_column'] = source.data[year_select.value]
    source.change.emit()
    line_fig.reset.emit()
"""))

top_area = row(year_select, ability_select)
show(layout(column([top_area, heatmap, line_fig]), sizing_mode="stretch_both"))

Thank you so much for your help man. I sincerely appreciate it.

⌁   Link to post
tvkyq
tvkyq

Alright, I’ve tried figuring out how to rebuild the data with JS from something @carolyn kindly helped me with a few months ago, and I think I’ve almost got it, but can’t quite figure out how to implement it.

In the for loop where we’re making the lines I’m unsure how to pass the source as subset_source while also keeping the data=df[df.option==cause] condition:

import pandas as pd
from bokeh.models import LinearColorMapper, ColumnDataSource, Slider, Select, CustomJSFilter, CDSView, CustomJS, GroupFilter
from bokeh.layouts import row, column, layout
from bokeh.plotting import figure, output_file, show
from bokeh.palettes import Viridis256, Category20_20

df = pd.read_excel('https://cjdixon.s3-ap-southeast-2.amazonaws.com/bokeh/heatmap_linegraph_datademo.xlsx', index_col=0)
df = df.reset_index()

df = df.rename(columns={n: str(n) for n in range(1,11)})

output_file('heatmap_linegraph.html', title='whatever', mode='inline')

df['period'] = df['period'].astype(str)
periods = df.period.unique().tolist()
causes = df.option.unique().tolist()
abilities = df.ability.unique().tolist()
df['active_column'] = df['5']

source = ColumnDataSource(data=df)

active = 5
color_mapper = LinearColorMapper(palette=Viridis256,
                                 low=0,
                                 high=0.02)

year_select = Slider(value=active, start=1, end=10, step=1)
ability_select = Select(value='noob', options=['l33t', 'noob'])

ability_filter = CustomJSFilter(args=dict(ability_select=ability_select), code='''
    var indices = []
    for (var i = 0; i < source.get_length(); i++){
        if (source.data['ability'][i] == ability_select.value){
                indices.push(true);
            } else {
                indices.push(false);
            }
        }
        return indices;
''')

subset_source = ColumnDataSource(data=source.data.copy())
fields_to_update = list(df.columns.values)
ability_callback = CustomJS(args=dict(source=source, subset_source=subset_source, ability_select=ability_select, fields_to_update=fields_to_update), code="""
    subset_source.clear();
    for (i = 0; i < source.data.x.length; i++) {
        if (source.data.ability[i] == ability_select.value) {
            for (j=0; j < fields_to_update.length; j++) {
                subset_source.data[fields_to_update[j]].push(source.data[fields_to_update[j]][i]);
            }
        }
    }'
    subset_source.change.emit();
""")

view = CDSView(source=source, filters=[ability_filter])
heatmap = figure(x_range=periods, y_range=causes,
                 x_axis_location="above", sizing_mode="stretch_both")

heatmap_renderer = heatmap.rect(x="period", y="option", width=1, height=0.95,
                                source=source, view=view,
                                fill_color={'field': str(active), 'transform': color_mapper},
                                line_color=None, name=str(active))
line_fig = figure(sizing_mode="stretch_both", y_range = (0, .03)
, x_range = (0, 60))
line_renderers = []
for cause, color in zip(causes, Category20_20):
    r = line_fig.line(x='period'
                      ,y=str(active)
                      ,color=color
                      ,line_width=3
                      ,source= ColumnDataSource(data=df[df.option==cause])
                      ,legend_label=str(cause))
    line_renderers.append(r)

ability_select.js_on_change('value', ability_callback)

year_select.js_on_change('value', CustomJS(args=dict(heatmap_renderer=heatmap_renderer, p=heatmap, year_select=year_select, source=source, ability_select=ability_select, line_fig=line_fig, line_renderers=line_renderers), code="""\
    const active = cb_obj.value;
    const data = heatmap_renderer.data_source.data[active];
    heatmap_renderer.name = String(active);
    const {transform} = heatmap_renderer.glyph.fill_color;
    heatmap_renderer.glyph.fill_color = {field: cb_obj.value, transform: transform};
    for (const lr of line_renderers) {
    lr.glyph.y = {field: active};
    }    
    source.data['active_column'] = source.data[year_select.value]
    source.change.emit()
    line_fig.reset.emit()
"""))

top_area = row(year_select, ability_select)
show(layout(column([top_area, heatmap, line_fig]), sizing_mode="stretch_both"))

Any ideas? We’re so close!

⌁   Link to post
carolyn
carolyn

Using @p-himik’s suggestion, I rejiggered the last code paste a little bit.

import pandas as pd
from bokeh.models import LinearColorMapper, ColumnDataSource, Slider, Select, CustomJSFilter, CDSView, CustomJS, GroupFilter
from bokeh.layouts import row, column, layout
from bokeh.plotting import figure, output_file, show
from bokeh.palettes import Viridis256, Category20_20

df = pd.read_excel('https://cjdixon.s3-ap-southeast-2.amazonaws.com/bokeh/heatmap_linegraph_datademo.xlsx', index_col=0)
df.reset_index(drop=True, inplace=True)
df = df.astype('object')  # float columns were getting converted to Float64Arrays in the js callbacks, which have immutable lengths (push function not available)
df = df.rename(columns={n: str(n) for n in range(1, 11)})

#output_file('heatmap_linegraph.html', title='whatever', mode='inline')

df['period'] = df['period'].astype(str)
periods = df.period.unique().tolist()
causes = df.option.unique().tolist()
abilities = df.ability.unique().tolist()
df['active_column'] = df['5']

source = ColumnDataSource(data=df)

active = 5
color_mapper = LinearColorMapper(palette=Viridis256, low=0, high=0.02)

year_select = Slider(value=active, start=1, end=10, step=1)
ability_select = Select(value='noob', options=['l33t', 'noob'])

ability_filter = CustomJSFilter(args=dict(ability_select=ability_select), code="""
    var indices = []
    for (var i = 0; i < source.get_length(); i++){
        if (source.data['ability'][i] == ability_select.value){
                indices.push(true);
            } else {
                indices.push(false);
            }
        }
        return indices;
""")

view = CDSView(source=source, filters=[ability_filter])
heatmap = figure(x_range=periods, y_range=causes,
                 x_axis_location="above", sizing_mode="stretch_both")

heatmap_renderer = heatmap.rect(x="period", y="option", width=1, height=0.95,
                                source=source, view=view,
                                fill_color={'field': str(active), 'transform': color_mapper},
                                line_color=None, name=str(active))
line_fig = figure(sizing_mode="stretch_both", y_range=(0, .03), x_range=(0, 60))
line_renderers = []
line_renderer_source_subsets = []
for cause, color in zip(causes, Category20_20):
    r = line_fig.line(x='period'
                      , y=str(active)
                      , color=color
                      , line_width=3
                      , source=ColumnDataSource(data=df[df.option == cause].reset_index(drop=True))
                      , legend_label=str(cause))
    line_renderers.append(r)
    # for each line, maintain a subset that is filtered by option but not by ability; this is the "master" source
    # for that line, which will then be filtered by ability in the ability callback.
    line_renderer_source_subsets.append(ColumnDataSource(data=df[df.option == cause].reset_index(drop=True)))

fields_to_update = list(df.columns.values) + ['index']
ability_select.js_on_change('value', CustomJS(args=dict(source=source, heatmap_source=source,
                                                        line_renderers=line_renderers,
                                                        line_renderer_source_subsets=line_renderer_source_subsets,
                                                        ability_select=ability_select,
                                                        fields_to_update=fields_to_update), code="""
    // CDSView takes care of heatmap filtering by ability
    heatmap_source.change.emit();
    
    // filter lines by ability.
    // iterate over all lines:
    for (var m = 0; m < line_renderers.length; m++) {
        // clear out renderer's old data source
        line_renderers[m].data_source.clear();
        // iterate over all rows in 'master' data source for this line... 
        for (var n = 0; n < line_renderer_source_subsets[m].data.index.length; n++) {
            // save the ones matching the selected ability...
            if (line_renderer_source_subsets[m].data.ability[n] == ability_select.value) {
                // and for each field we're tracking, push the field/value combination to this line's data source
                for (var f in fields_to_update) {
                    var field = fields_to_update[f];
                    line_renderers[m].data_source.data[field].push(line_renderer_source_subsets[m].data[field][n]);
                }
            }
        }
        line_renderers[m].data_source.change.emit();
    }
"""))

year_select.js_on_change('value', CustomJS(args=dict(heatmap_renderer=heatmap_renderer,
                                                     # p=heatmap,
                                                     year_select=year_select,
                                                     source=source,
                                                     # ability_select=ability_select,
                                                     line_fig=line_fig,
                                                     line_renderers=line_renderers), code="""
    const active = cb_obj.value;
    const data = heatmap_renderer.data_source.data[active];
    heatmap_renderer.name = String(active);
    const {transform} = heatmap_renderer.glyph.fill_color;
    heatmap_renderer.glyph.fill_color = {field: cb_obj.value, transform: transform};
    for (const lr of line_renderers) {
      lr.glyph.y = {field: active};
    }    
    source.data['active_column'] = source.data[year_select.value]
    source.change.emit()
    line_fig.reset.emit()
"""))

top_area = row(year_select, ability_select)
show(layout(column([top_area, heatmap, line_fig]), sizing_mode="stretch_both"))
⌁   Link to post

End of archived discussion · Replies are disabled