Dear Bokeh user,
After several month of development I am pleased to announce that our Python Covid Analysis toolkit, aka PyCoa, is available:
http://pycoa.fr/ or GitHub - coa-project/pycoa at v2.0
It offers:
- a simple access to the main Covid-19 databases
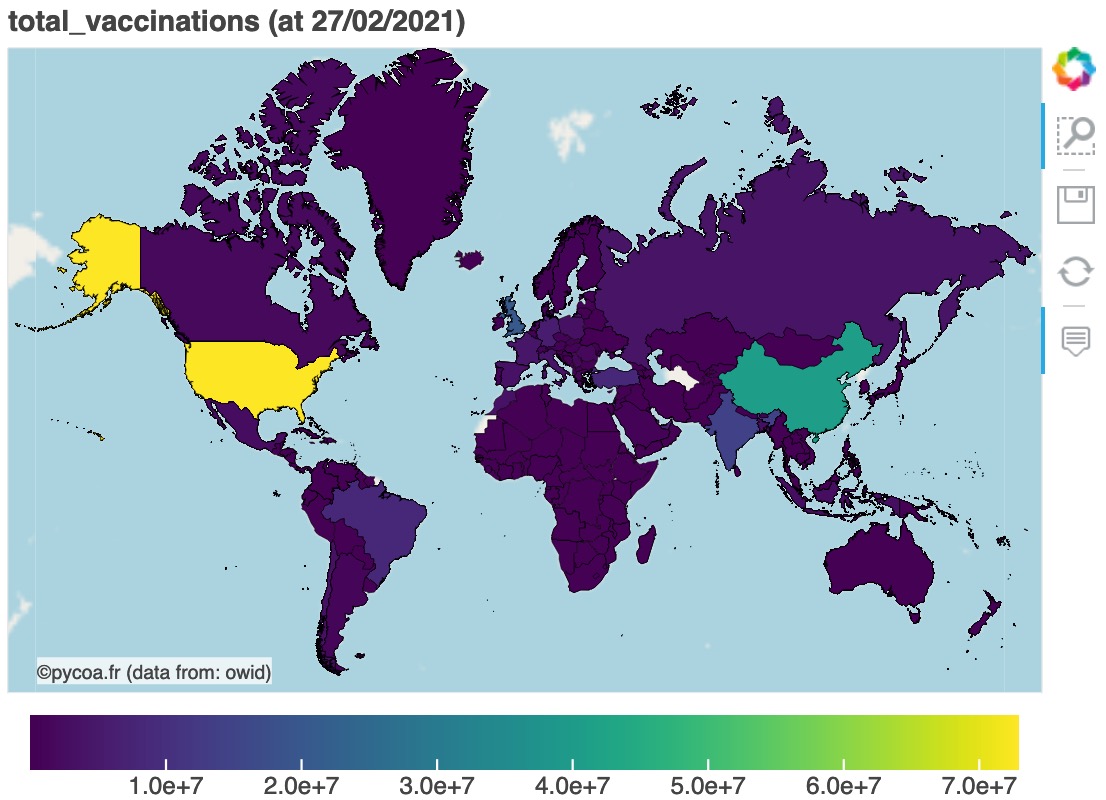
- tools to display and analyse Covid19 data (histogram, time series, maps …) using Bokeh visualization
All of this with only a couple of Python code lines!
Of course our software is under MIT licence so 100% free & open source.
Under the current version (v2.0) the available databases are:
- Johns Hopkins Coronavirus Resource Center (JHU & JHU-USA)
- Our World Data (OWID)
- Santé Public France (SPF) & OpenCovid19 (France data)
Feel free to use it! Feedbacks and comments — not to many :-),
are welcome.
Take Care,
Olivier on behalf of the PyCoa team.
 For the moment only data from JHU or OWID for Papua New Guinea is available. If you have any national Covid19 database (and a more precise json file) let us know, we will please to add it to you …