I’m migrating from 1.4.0 to 2.3.0 and came across this issue which also occurs in 2.2.2
Currently I’m not sure whether I was originally doing things incorrectly, or whether this is a regression break.
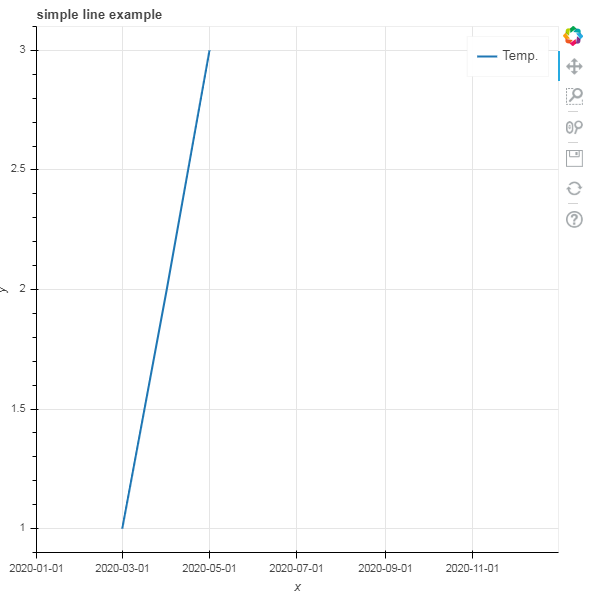
I’ve boiled it down to a minimal test case. Essentially, I want to fix the x_range between 2 specific dates, then plot some stuff.
In 1.4.0 I get this;
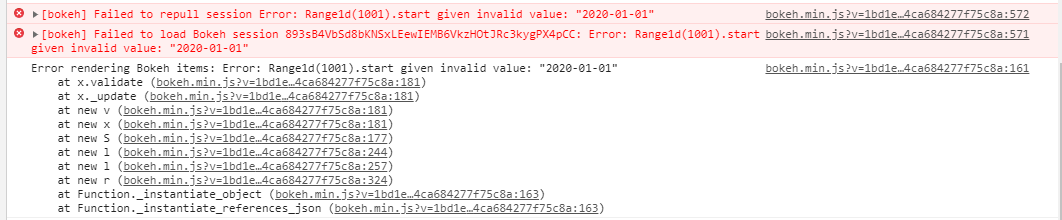
But in 2.2.2 and 2.3.0dev3 I get the javascript error;
Self-contained minmal example;
from bokeh.models import DatetimeTickFormatter, Range1d
from bokeh.plotting import curdoc, figure
from datetime import date

# Get a reference to the document we will be creating
doc = curdoc()

# create a new plot with a title and axis labels.  Set range to be 1st Jan 2020 to 31st Dec 2020
plot = figure(
    title="simple line example", x_axis_label='x', y_axis_label='y',
    x_range=Range1d(start=date(2020, 1, 1), end=date(2020, 12, 31))
)

# plot a line through three dates
x = [date(2020, 3, 1), date(2020, 4, 1), date(2020, 5, 1)]
y = [1, 2, 3]
plot.line(x, y, legend_label="Temp.", line_width=2)

# Format the x-axis nicely
plot.xaxis.formatter = DatetimeTickFormatter(days=['%Y-%m-%d'], months=['%Y-%m-%d'], years=['%Y-%m-%d'])

# Put the plot into the document
doc.add_root(plot)