

I have a plot and I need the ranges of that plot to generate a calculation. I used a simple callback to get the range. My x-axis is a datetime and I expected the callback to return a datetime, but instead, it’s returning a float. Where is this float coming from and how can I convert it back to a datetime?
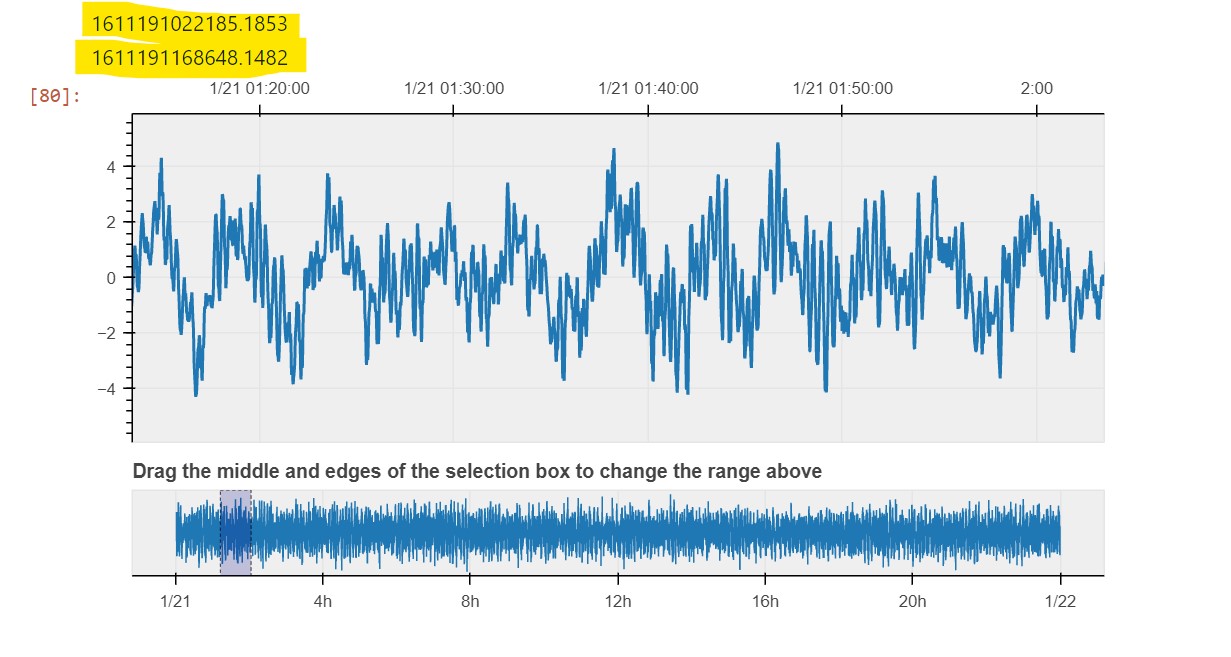
This is a screenshot of the plot with the callback value printed at the top:
The callback I’m using is:
def getStart(attr, old, new):

    START=(old)

    print(START)

start= p.x_range.on_change('start', getStart)
Any ideas? Thanks!


