☰Read-only archive⌕
Looking for help with Bokeh?

This is a read-only archive. Ask questions and join the conversation on GitHub.

Visit Community Support on GitHub →
Archived discussions · Captured October 28, 2026

RangeTool not working in Jupyter notebook

Community Support
KurtP20
KurtP20

Hi,
I am trying to use the RangeTool in a Jupyter notebook, but I always get an “Uncaught (in promise) Error: models must be owned by only a single document” error. Here is a minimal code that reproduces the error:

from bokeh.io import output_notebook, show
from bokeh.plotting import figure
from bokeh.models import ColumnDataSource, DatetimeTickFormatter, RangeTool, Range1d
from bokeh.layouts import column
output_notebook()

timestamps = [1, 2, 3, 4, 5]
values = [10, 20, 30, 40, 50]
dummy_data = {'timestamp': timestamps, 'value': values}
source = ColumnDataSource(dummy_data)

x_range = Range1d(start=timestamps[0], end=timestamps[-1])
y_range = Range1d(start=min(values), end=max(values))

select = figure(x_axis_type="linear", x_range=x_range, y_range=y_range, tools="")
range_tool = RangeTool(x_range=x_range)
select.add_tools(range_tool)

select.line(x='timestamp', y='value', source=source)

show(select)

If I comment the line select.add_tools(range_tool), the plot is shown, so I guess the notebook is setup correctly. I work with Bokeh 3.3.0 and JupyterLab 3.6.3 in Firefox. I have tried essentially all the recommendations I could find without success. Any recommendations would be much appreciated.
Thanks, Kurt

⌁   Link to post
Bryan
Bryan

The code above generates output for me, but also behaves very badly since it is not expected usage to attach a range tool to the same plot as the configured range. Typically a range tool is added to one plot and configured with the range of another plot. (See e.g. this example).

In any case, we’d need a more exact sequence of steps to reproduce or possible a screen capture that shows exactly the sequence of steps. But my first suggestion is to construct an example that uses the range tool as intended (i.e. not “self-attached” to the same plot since you could end up with infinite range updates ping-ponging that way, as the tool updates the plot which updates the tool which updates the plot…)

⌁   Link to post
KurtP20
KurtP20

Hi, hmm.
Thanks for your quick answer! Did you try run it twice?

The example above is a trimmed down version of the original cell:

p = figure(title="flow rate", 
           x_axis_type="datetime", x_range=(rub128basin['timestamp'][1], rub128basin['timestamp'][10000]), 
           y_axis_label='Flow rate [l/s]', 
           sizing_mode="stretch_width", height=350,
            tools="xpan")

source = ColumnDataSource(rub128basin)
p.line(x="timestamp", y="value", source=source, line_width=2)

# format the x-axis tick labels as datetime strings
p.xaxis.formatter = DatetimeTickFormatter(hours="%d %B %Y", days="%Y%m%d", months="%d %B %Y", years="%d %B %Y")


# range tool
select = figure(title="Drag the middle and edges of the selection box to change the range above",
                x_axis_type="datetime", 
                y_axis_type=None, y_range=p.y_range,
                sizing_mode="stretch_width", height=150,
                tools="") # tools="", toolbar_location=None, background_fill_color="#efefef"

range_tool = RangeTool(x_range=p.x_range)
range_tool.overlay.fill_color = "navy"
range_tool.overlay.fill_alpha = 0.2

select.line(x="timestamp", y="value", source=source)
select.ygrid.grid_line_color = None
select.add_tools(range_tool)

# show the results
#show(p)
show(column(p, select))

I wonder why it works on your machine, but well, it seems to be related to my setup then.

⌁   Link to post
KurtP20
KurtP20

Oh, sorry, wrong code:


from bokeh.io import output_notebook, show, output_file
from bokeh.plotting import figure
from bokeh.models import ColumnDataSource, DatetimeTickFormatter, RangeTool, Range1d
from bokeh.layouts import column
output_notebook()


timestamps = [1, 2, 3, 4, 5]
values = [10, 20, 30, 40, 50]
dummy_data = {'timestamp': timestamps, 'value': values}
source = ColumnDataSource(dummy_data)

p = figure(title="test", 
           x_axis_type="datetime", x_range=(dummy_data['timestamp'][1], dummy_data['timestamp'][-1]), 
           y_axis_label='Flow rate [l/s]', 
           sizing_mode="stretch_width", height=350,
           tools="xpan")

p.line(x="timestamp", y="value", source=source, line_width=2)

# format the x-axis tick labels as datetime strings
p.xaxis.formatter = DatetimeTickFormatter(hours="%d %B %Y", days="%Y%m%d", months="%d %B %Y", years="%d %B %Y")


# range tool
select = figure(title="Drag the middle and edges of the selection box to change the range above",
                x_axis_type="datetime", 
                y_axis_type=None, y_range=p.y_range,
                sizing_mode="stretch_width", height=150,
                tools="") # tools="", toolbar_location=None, background_fill_color="#efefef"

range_tool = RangeTool(x_range=p.x_range)
range_tool.overlay.fill_color = "navy"
range_tool.overlay.fill_alpha = 0.2

select.line(x="timestamp", y="value", source=source)
select.ygrid.grid_line_color = None
select.add_tools(range_tool)

# show the results
show(p)
show(column(p, select))

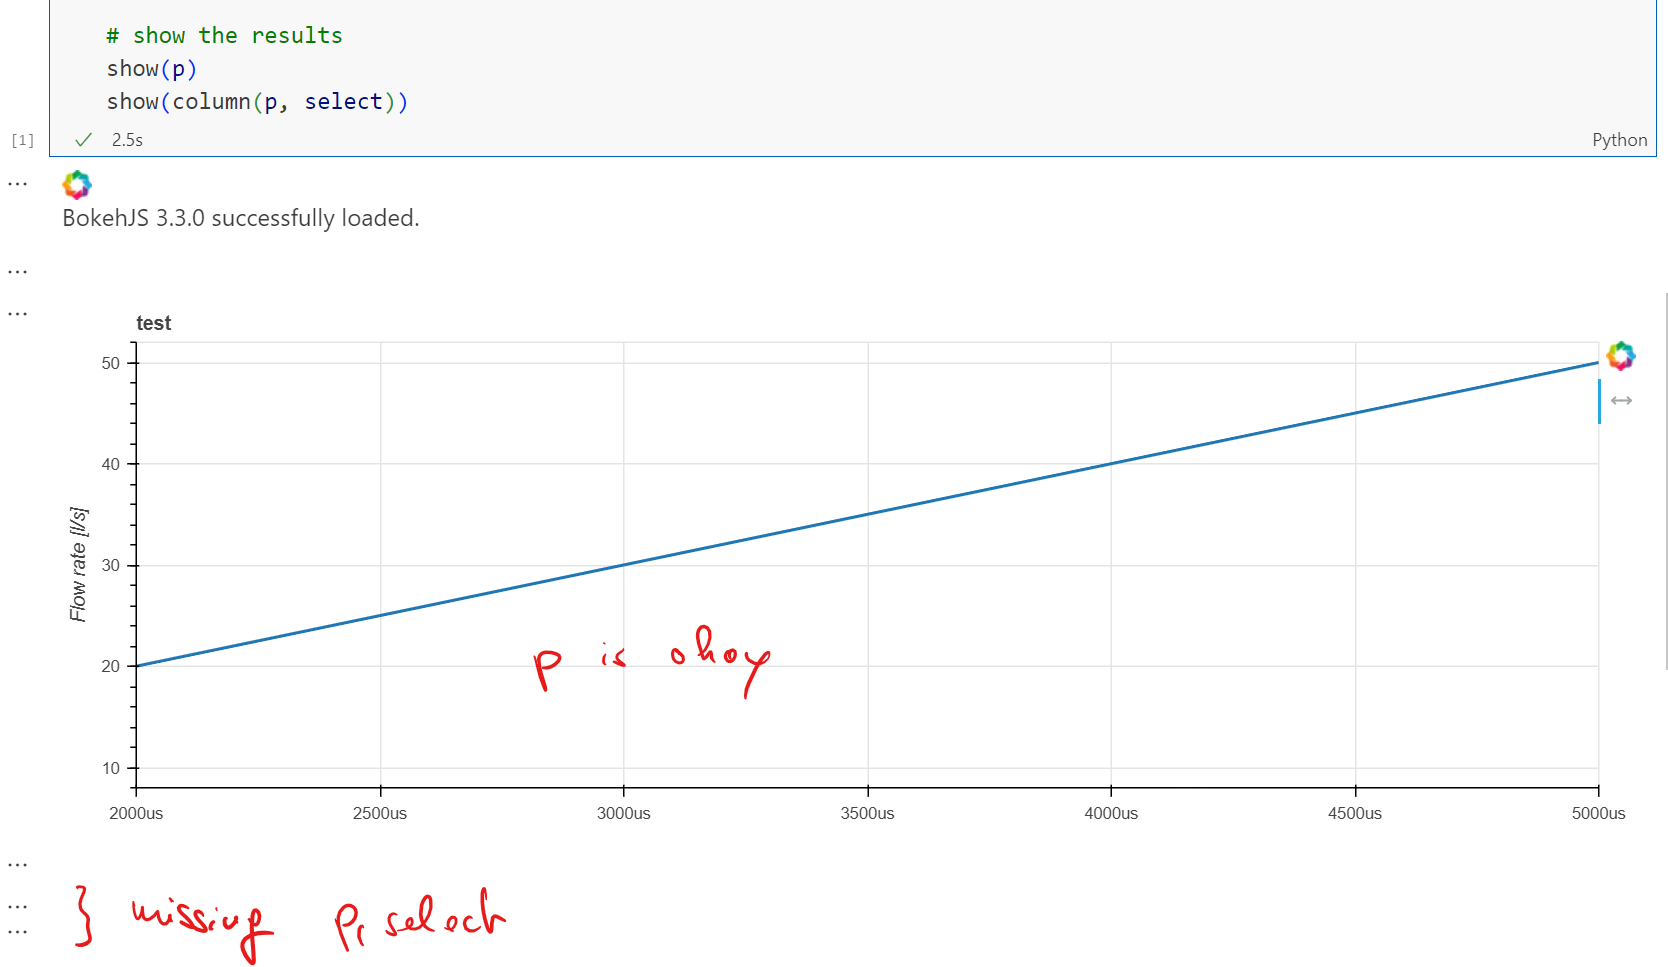
Here is a screenshot of the output of the cell:

⌁   Link to post
Bryan
Bryan

This seems like a bug actually, please open a GitHub Issue with full details and reference this discussion as well.

Edit: note that ending a cell with two show calls:

show(p)
show(column(p, select))

is pretty unusual (to me, at least) and the issue only needs the last show to demonstrate.

⌁   Link to post

End of archived discussion · Replies are disabled