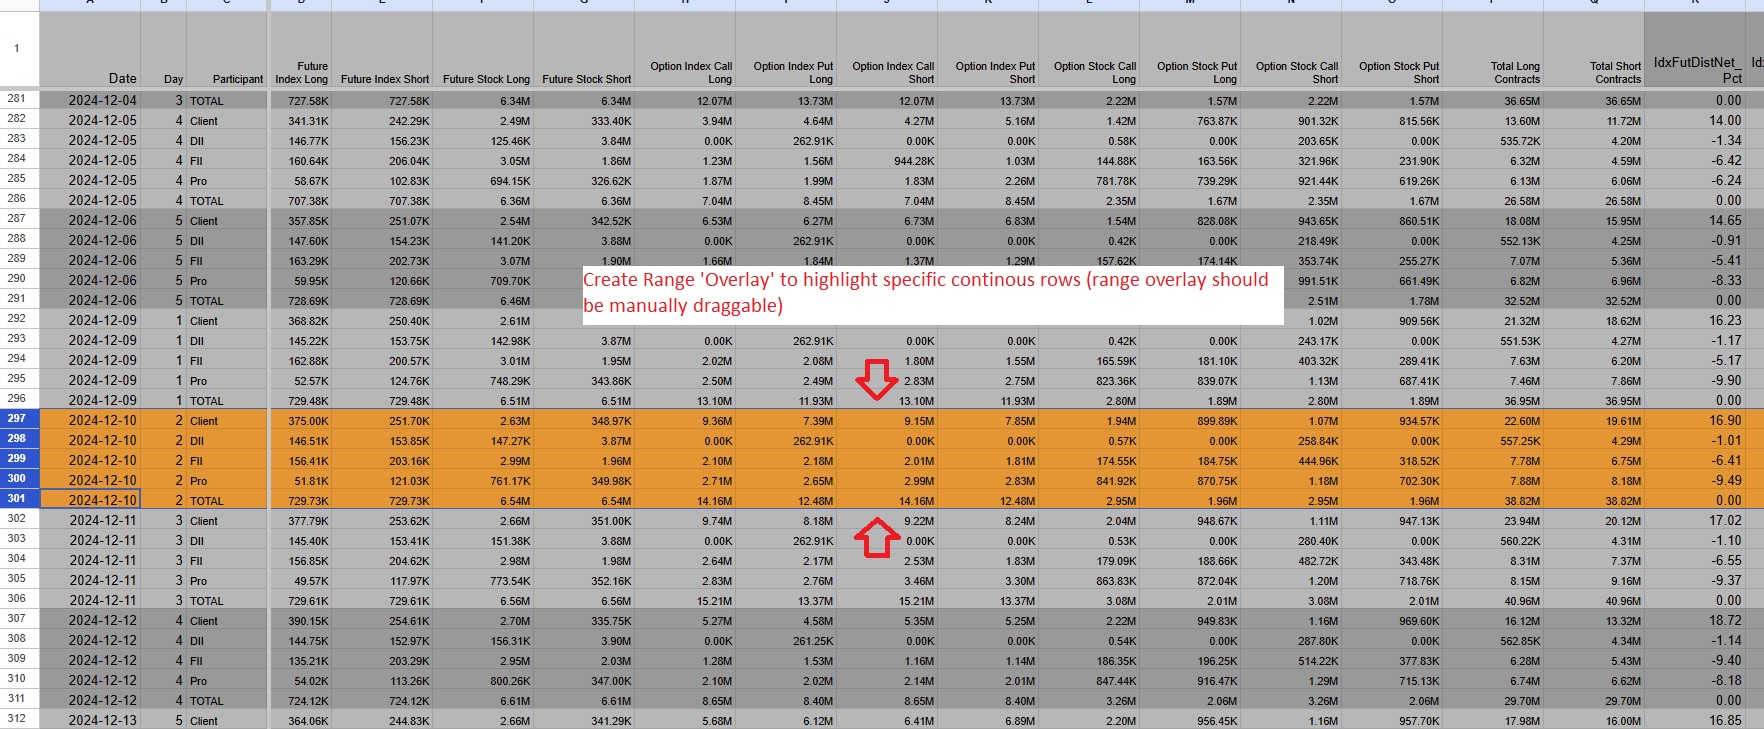
Is it possible to add a Rangetool overlay on a Datatable(for highlighting specific data)?
Using ‘Plot(layout(data_table))’ gives error : ‘positional arguments are not allowed’
from bokeh.models import DataTable, TableColumn, ColumnDataSource, RangeTool, CustomJS, Plot
from bokeh.layouts import layout
from bokeh.plotting import figure, show
import numpy as np


data = {
    "Index": [f"Row {i}" for i in range(1, 101)],
    "Value1": np.random.randint(1, 100, size=100),
    "Value2": np.random.randint(1, 100, size=100),
    "Value3": np.random.randint(1, 100, size=100),
    "Value4": np.random.randint(1, 100, size=100),
}
source = ColumnDataSource(data)

columns = [
    TableColumn(field="Index", title="Index"),
    TableColumn(field="Value1", title="Value1"),
    TableColumn(field="Value2", title="Value2"),
    TableColumn(field="Value3", title="Value3"),
    TableColumn(field="Value4", title="Value4"),
]

data_table = DataTable(source=source, columns=columns, width=400, height=300)


range_tool = RangeTool(x_range=Range1d(0,data_table.width),y_range = Range1d(0,(data_table.height)/2),y_interaction = True)
range_tool.overlay.fill_color = "gray"
range_tool.overlay.fill_alpha = 0.2


p = Plot(layout(data_table))
table = p.add_tools(range_tool)
show(table)