☰Read-only archive⌕
Looking for help with Bokeh?

This is a read-only archive. Ask questions and join the conversation on GitHub.

Visit Community Support on GitHub →
Archived discussions · Captured October 28, 2026

rbokeh: Color gradient plot/legend

Community Support
jeremiah_rounds
jeremiah_rounds

Hi,

rbokeh question.

I implemented a heatmap with ly_crect, but now I need to make a legend.

The legend is going to take the form of something like the color gradient:

The question is:

  • what basic rbokeh layer do you recommend to do this sort of color gradient?

  • Is there any positioning tricks to get a small figure offset from a larger one?

Because the “legend” with “heatmap” is intended to go together in a Trelliscope display, I have to somehow get the two to be in one rbokeh figure.

Thanks,

Jeremiah

⌁   Link to post
jeremiah_rounds
jeremiah_rounds

This is just kind of the R version of this question:
https://groups.google.com/a/continuum.io/forum/#!topic/bokeh/N_wiRxF0e1I

···

On Thursday, January 21, 2016 at 3:12:25 PM UTC-8, jeremiah rounds wrote:

Hi,

rbokeh question.

I implemented a heatmap with ly_crect, but now I need to make a legend.

The legend is going to take the form of something like the color gradient:

http://www.r-bloggers.com/r-user-group-recap-heatmaps-and-using-the-caret-package/

The question is:

  • what basic rbokeh layer do you recommend to do this sort of color gradient?
  • Is there any positioning tricks to get a small figure offset from a larger one?

Because the “legend” with “heatmap” is intended to go together in a Trelliscope display, I have to somehow get the two to be in one rbokeh figure.

Thanks,

Jeremiah

⌁   Link to post
jeremiah_rounds
jeremiah_rounds

I ended up going with ly_crect:

legend_data = list(legend_values = c(-0.545923348, -0.319339005,

-0.092754662, 0.133829681, 0.360414024, 0.586998367, 0.81358271,

1.040167053, 1.266751396, 1.493335739), width = c(0.22658,

0.22658, 0.22658, 0.22658, 0.22658, 0.22658, 0.22658, 0.22658,

0.22658, 0.22658), legend_colors = c(1L, 2L, 3L, 10L, 9L,

8L, 7L, 6L, 5L, 4L), y = c(1, 1, 1, 1, 1, 1, 1, 1, 1, 1))

legend = figure(height=150, tools=NULL, xlab=“Legend”, ygrid=FALSE, xgrid=FALSE,xaxes=TRUE, yaxes=FALSE , xlim=r) %>% ly_crect(x=legend_values,y=y, data=legend_data,color=legend_colors,width=width, line_alpha=0,fill_alpha=fill_alpha)

···

On Thursday, January 21, 2016 at 3:12:25 PM UTC-8, jeremiah rounds wrote:

Hi,

rbokeh question.

I implemented a heatmap with ly_crect, but now I need to make a legend.

The legend is going to take the form of something like the color gradient:

http://www.r-bloggers.com/r-user-group-recap-heatmaps-and-using-the-caret-package/

The question is:

  • what basic rbokeh layer do you recommend to do this sort of color gradient?
  • Is there any positioning tricks to get a small figure offset from a larger one?

Because the “legend” with “heatmap” is intended to go together in a Trelliscope display, I have to somehow get the two to be in one rbokeh figure.

Thanks,

Jeremiah

⌁   Link to post
jeremiah_rounds
jeremiah_rounds

Just piling on to my thread rather than start a new one =)

Step 2 of this gradient legend was to use grid_plot to lay it out. I noticed that grid_plot over-wrote my titles with the names of the list argument, but it does so with a font that is not very strong (either it is gray or has a light line-width). Is there any way to get “Figure 1” and “Figure 2” to be bolder in the snippet below? They are surrogates for “Legend” and “Plot Title”.

data(iris)

p1 = figure() %>% ly_points(iris$Sepal.Width, iris$Sepal.Length)

p2 = figure() %>% ly_points(iris$Sepal.Length, iris$Sepal.Width)

plots = list()

plots[[“Figure 1”]] = p1

plots[[“Figure 2”]] = p2

grid_plot(plots, nrow=2, ncol=1)

···

On Thursday, January 21, 2016 at 3:12:25 PM UTC-8, jeremiah rounds wrote:

Hi,

rbokeh question.

I implemented a heatmap with ly_crect, but now I need to make a legend.

The legend is going to take the form of something like the color gradient:

http://www.r-bloggers.com/r-user-group-recap-heatmaps-and-using-the-caret-package/

The question is:

  • what basic rbokeh layer do you recommend to do this sort of color gradient?
  • Is there any positioning tricks to get a small figure offset from a larger one?

Because the “legend” with “heatmap” is intended to go together in a Trelliscope display, I have to somehow get the two to be in one rbokeh figure.

Thanks,

Jeremiah

⌁   Link to post
Sarah_Bird1
Sarah_Bird1

Hi Jeremiah,

I'm afraid I have zero clue about R. It's amazing how I don't recognize
anything you've written as Bokeh!

Anyway, just a stab in the dark, most text things have a property
`text_font_style` that you can set to `bold` if you haven't seen that.
This may be useless. Apologies if that's the case.

I'd love to see the full code and a screenshot when you're done so I can
get more of a flavor of how to execute this in R.

Sincerely,

Sarah Bird

···

On 1/21/16 4:04 PM, jeremiah rounds wrote:

Just piling on to my thread rather than start a new one =)

Step 2 of this gradient legend was to use grid_plot to lay it out. I
noticed that grid_plot over-wrote my titles with the names of the list
argument, but it does so with a font that is not very strong (either it
is gray or has a light line-width). Is there any way to get "Figure 1"
and "Figure 2" to be bolder in the snippet below? They are surrogates
for "Legend" and "Plot Title".

data(iris)
p1 = figure() %>% ly_points(iris$Sepal.Width, iris$Sepal.Length)
p2 = figure() %>% ly_points(iris$Sepal.Length, iris$Sepal.Width)
plots = list()
plots[["Figure 1"]] = p1
plots[["Figure 2"]] = p2
grid_plot(plots, nrow=2, ncol=1)

On Thursday, January 21, 2016 at 3:12:25 PM UTC-8, jeremiah rounds wrote:

    Hi,

    rbokeh question.

    I implemented a heatmap with ly_crect, but now I need to make a legend.

    The legend is going to take the form of something like the color
    gradient:
    R User Group Recap: Heatmaps and Using the caret Package | R-bloggers
    <GTA R Users Group – Using R for Data Mining Competitions | R-bloggers;

    The question is:
    - what basic rbokeh layer do you recommend to do this sort of color
    gradient?
    - Is there any positioning tricks to get a small figure offset from
    a larger one?

    Because the "legend" with "heatmap" is intended to go together in a
    Trelliscope display, I have to somehow get the two to be in one
    rbokeh figure.

    Thanks,
    Jeremiah
--
You received this message because you are subscribed to the Google
Groups "Bokeh Discussion - Public" group.
To unsubscribe from this group and stop receiving emails from it, send
an email to bokeh+unsubscribe@continuum.io
<mailto:bokeh+unsubscribe@continuum.io>.
To post to this group, send email to bokeh@continuum.io
<mailto:bokeh@continuum.io>.
To view this discussion on the web visit
https://groups.google.com/a/continuum.io/d/msgid/bokeh/bcf519c1-1fca-402b-bc0b-78f2b7a1032e%40continuum.io
<https://groups.google.com/a/continuum.io/d/msgid/bokeh/bcf519c1-1fca-402b-bc0b-78f2b7a1032e%40continuum.io?utm_medium=email&utm_source=footer&gt;\.
For more options, visit https://groups.google.com/a/continuum.io/d/optout\.

⌁   Link to post
Tong_Sun
Tong_Sun

Hi,

I’m interested in the answer as well.

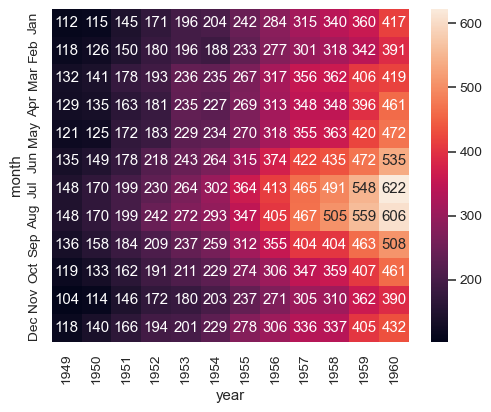
Can Bokeh heatmaps now support gradient legend?

Further, can each cell be annotated with the numeric value?

Like the following, taken from http://stanford.edu/~mwaskom/software/seaborn/generated/seaborn.heatmap.html#seaborn.heatmap

../_images/seaborn-heatmap-5.png

Thanks

···

On Thursday, January 21, 2016 at 6:12:25 PM UTC-5, jeremiah rounds wrote:

Hi,

rbokeh question.

I implemented a heatmap with ly_crect, but now I need to make a legend.

The legend is going to take the form of something like the color gradient:

http://www.r-bloggers.com/r-user-group-recap-heatmaps-and-using-the-caret-package/

The question is:

  • what basic rbokeh layer do you recommend to do this sort of color gradient?
⌁   Link to post

End of archived discussion · Replies are disabled
