Hi,
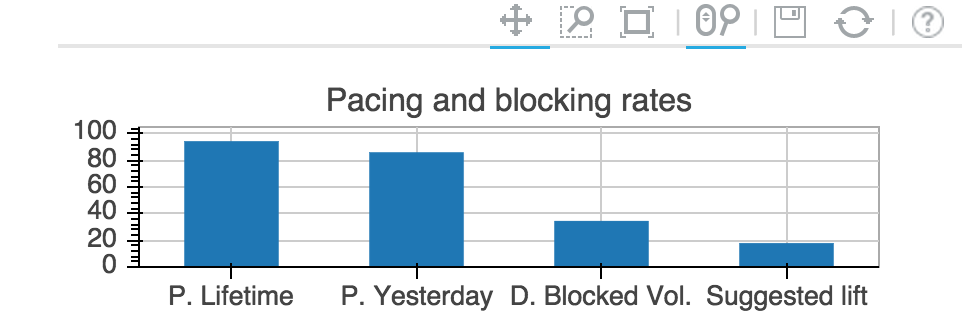
Consider the following rect plot. Is there any way to remove its toolbar? I am putting together an app with several widgets within horizontal and vertical boxes (i.e. HBox and VBox) and the toolbar takes too much space.
Alternatively, is there any way to reduce the padding between widgets within a HBox or VBox?
Thanks!
Josh
Hi,
I’m not seeing your inline image. But here’s some thoughts:
- you can always set toolbar_location=None (on your plot) to completely disappear the toolbar. Note: if you do that you probably want to make sure that tools=“” otherwise the default wheel_zoom will still be enabled, but you’ll have no way to reset the chart.
Here’s some examples: https://github.com/bokeh/bokeh/blob/sparkline/examples/glyphs/sprint.py#L65 also, you can use it after using the charts interface to make your plot see: https://github.com/birdsarah/bokeh/blob/sparkline/examples/plotting/file/sparkline.py#L39
- you can experiment min_border=0 (or another integer) to try and get less space between plots. (http://bokeh.pydata.org/en/latest/docs/user_guide/objects.html?highlight=min_border_left#plots - http://bokeh.pydata.org/en/latest/docs/reference/models.html?highlight=min_border#bokeh.models.plots.Plot.min_border)
Here’s an example of setting min_border to 0 after using the Charts interface:https://github.com/birdsarah/bokeh/blob/sparkline/examples/plotting/file/sparkline.py#L40 or in the burtin gallery http://bokeh.pydata.org/en/latest/docs/gallery/burtin.html
Hope that helps,
Sarah
···
On Thu, Feb 26, 2015 at 7:36 PM, Josh Wasserstein [email protected] wrote:
Hi,
Consider the following rect plot. Is there any way to remove its toolbar? I am putting together an app with several widgets within horizontal and vertical boxes (i.e. HBox and VBox) and the toolbar takes too much space.
Alternatively, is there any way to reduce the padding between widgets within a HBox or VBox?
Thanks!
Josh
–
You received this message because you are subscribed to the Google Groups “Bokeh Discussion - Public” group.
To unsubscribe from this group and stop receiving emails from it, send an email to [email protected].
To post to this group, send email to [email protected].
To view this discussion on the web visit https://groups.google.com/a/continuum.io/d/msgid/bokeh/CAD4ivxVjK3_zTrOoNTJnY6XBfGn20gQW5SmP%3DZVwcbK_pNsVDg%40mail.gmail.com.
For more options, visit https://groups.google.com/a/continuum.io/d/optout.
(saw the image - forgot images were turned off in my email!)
I think my suggestions will help.
···
On Thu, Feb 26, 2015 at 8:50 PM, Sarah Bird [email protected] wrote:
Hi,
I’m not seeing your inline image. But here’s some thoughts:
- you can always set toolbar_location=None (on your plot) to completely disappear the toolbar. Note: if you do that you probably want to make sure that tools=“” otherwise the default wheel_zoom will still be enabled, but you’ll have no way to reset the chart.
Here’s some examples: https://github.com/bokeh/bokeh/blob/sparkline/examples/glyphs/sprint.py#L65 also, you can use it after using the charts interface to make your plot see: https://github.com/birdsarah/bokeh/blob/sparkline/examples/plotting/file/sparkline.py#L39
- you can experiment min_border=0 (or another integer) to try and get less space between plots. (http://bokeh.pydata.org/en/latest/docs/user_guide/objects.html?highlight=min_border_left#plots - http://bokeh.pydata.org/en/latest/docs/reference/models.html?highlight=min_border#bokeh.models.plots.Plot.min_border)
Here’s an example of setting min_border to 0 after using the Charts interface:https://github.com/birdsarah/bokeh/blob/sparkline/examples/plotting/file/sparkline.py#L40 or in the burtin gallery http://bokeh.pydata.org/en/latest/docs/gallery/burtin.html
Hope that helps,
Sarah
On Thu, Feb 26, 2015 at 7:36 PM, Josh Wasserstein [email protected] wrote:
Hi,
Consider the following rect plot. Is there any way to remove its toolbar? I am putting together an app with several widgets within horizontal and vertical boxes (i.e. HBox and VBox) and the toolbar takes too much space.
Alternatively, is there any way to reduce the padding between widgets within a HBox or VBox?
Thanks!
Josh
–
You received this message because you are subscribed to the Google Groups “Bokeh Discussion - Public” group.
To unsubscribe from this group and stop receiving emails from it, send an email to [email protected].
To post to this group, send email to [email protected].
To view this discussion on the web visit https://groups.google.com/a/continuum.io/d/msgid/bokeh/CAD4ivxVjK3_zTrOoNTJnY6XBfGn20gQW5SmP%3DZVwcbK_pNsVDg%40mail.gmail.com.
For more options, visit https://groups.google.com/a/continuum.io/d/optout.
Thank you Sarah. That helped!
Josh
···
On Thu, Feb 26, 2015 at 11:53 PM, Sarah Bird [email protected] wrote:
(saw the image - forgot images were turned off in my email!)
I think my suggestions will help.
–
You received this message because you are subscribed to the Google Groups “Bokeh Discussion - Public” group.
To unsubscribe from this group and stop receiving emails from it, send an email to [email protected].
To post to this group, send email to [email protected].
To view this discussion on the web visit https://groups.google.com/a/continuum.io/d/msgid/bokeh/CA%2BEr%2BdSZCDPLa%3DJzSR2GP2iNOYykOCrPTEUhRkoo3GhD49gfnA%40mail.gmail.com.
For more options, visit https://groups.google.com/a/continuum.io/d/optout.
On Thu, Feb 26, 2015 at 8:50 PM, Sarah Bird [email protected] wrote:
Hi,
I’m not seeing your inline image. But here’s some thoughts:
- you can always set toolbar_location=None (on your plot) to completely disappear the toolbar. Note: if you do that you probably want to make sure that tools=“” otherwise the default wheel_zoom will still be enabled, but you’ll have no way to reset the chart.
Here’s some examples: https://github.com/bokeh/bokeh/blob/sparkline/examples/glyphs/sprint.py#L65 also, you can use it after using the charts interface to make your plot see: https://github.com/birdsarah/bokeh/blob/sparkline/examples/plotting/file/sparkline.py#L39
- you can experiment min_border=0 (or another integer) to try and get less space between plots. (http://bokeh.pydata.org/en/latest/docs/user_guide/objects.html?highlight=min_border_left#plots - http://bokeh.pydata.org/en/latest/docs/reference/models.html?highlight=min_border#bokeh.models.plots.Plot.min_border)
Here’s an example of setting min_border to 0 after using the Charts interface:https://github.com/birdsarah/bokeh/blob/sparkline/examples/plotting/file/sparkline.py#L40 or in the burtin gallery http://bokeh.pydata.org/en/latest/docs/gallery/burtin.html
Hope that helps,
Sarah
On Thu, Feb 26, 2015 at 7:36 PM, Josh Wasserstein [email protected] wrote:
Hi,
Consider the following rect plot. Is there any way to remove its toolbar? I am putting together an app with several widgets within horizontal and vertical boxes (i.e. HBox and VBox) and the toolbar takes too much space.
Alternatively, is there any way to reduce the padding between widgets within a HBox or VBox?
Thanks!
Josh
–
You received this message because you are subscribed to the Google Groups “Bokeh Discussion - Public” group.
To unsubscribe from this group and stop receiving emails from it, send an email to [email protected].
To post to this group, send email to [email protected].
To view this discussion on the web visit https://groups.google.com/a/continuum.io/d/msgid/bokeh/CAD4ivxVjK3_zTrOoNTJnY6XBfGn20gQW5SmP%3DZVwcbK_pNsVDg%40mail.gmail.com.
For more options, visit https://groups.google.com/a/continuum.io/d/optout.