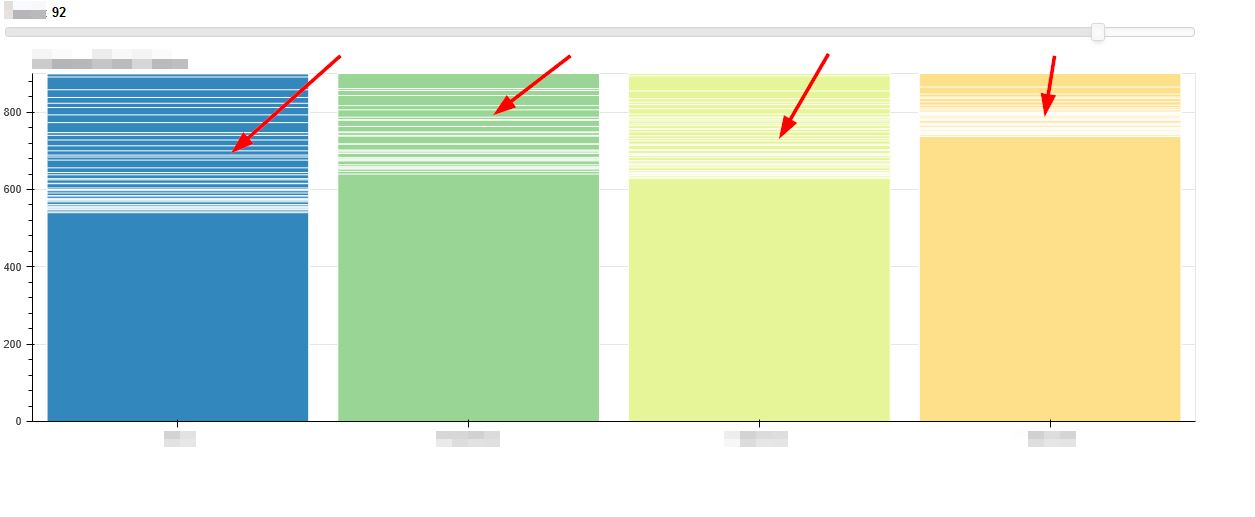
The problem I’m having may be self-inflicted, but we shall see. I’m running this code as a server and it renders just fine, but when I adjust the slider to fill (vertical increase) and then change the slider to reduce the bar (vertical decrease) I’m left with what looks like a ghosting effect or tracers as some may call it. I’ve looked around for documentation on how to overcome this and found nothing so far. Its either the way I’m drawing or I’m missing a parameter is my thoughts.
I’m unable to share the full code, but here are some key snippets.
threshSelect = Slider(title='Thresh', value=thresh, start=1, end=100, step=1)
threshSelect.on_change('value', updateThresh)
This is called in the initial plot and also in the callback “updateThresh”:
barchart.vbar(x='Category', top='Count', width=0.9, source=source, line_color='white', fill_color=factor_cmap('Category', palette=Spectral6, factors=cats))
This is what I see when scaling up then down on the Slider: