Representing data with two categories by both color and marker-shape

I’ll try to ask a better question. Here it goes:
I would like to create a scatter plot where each marker has a shape based on one category and a color based on a second category. I would also like to have two legends. One representing the shapes and one representing the colors.
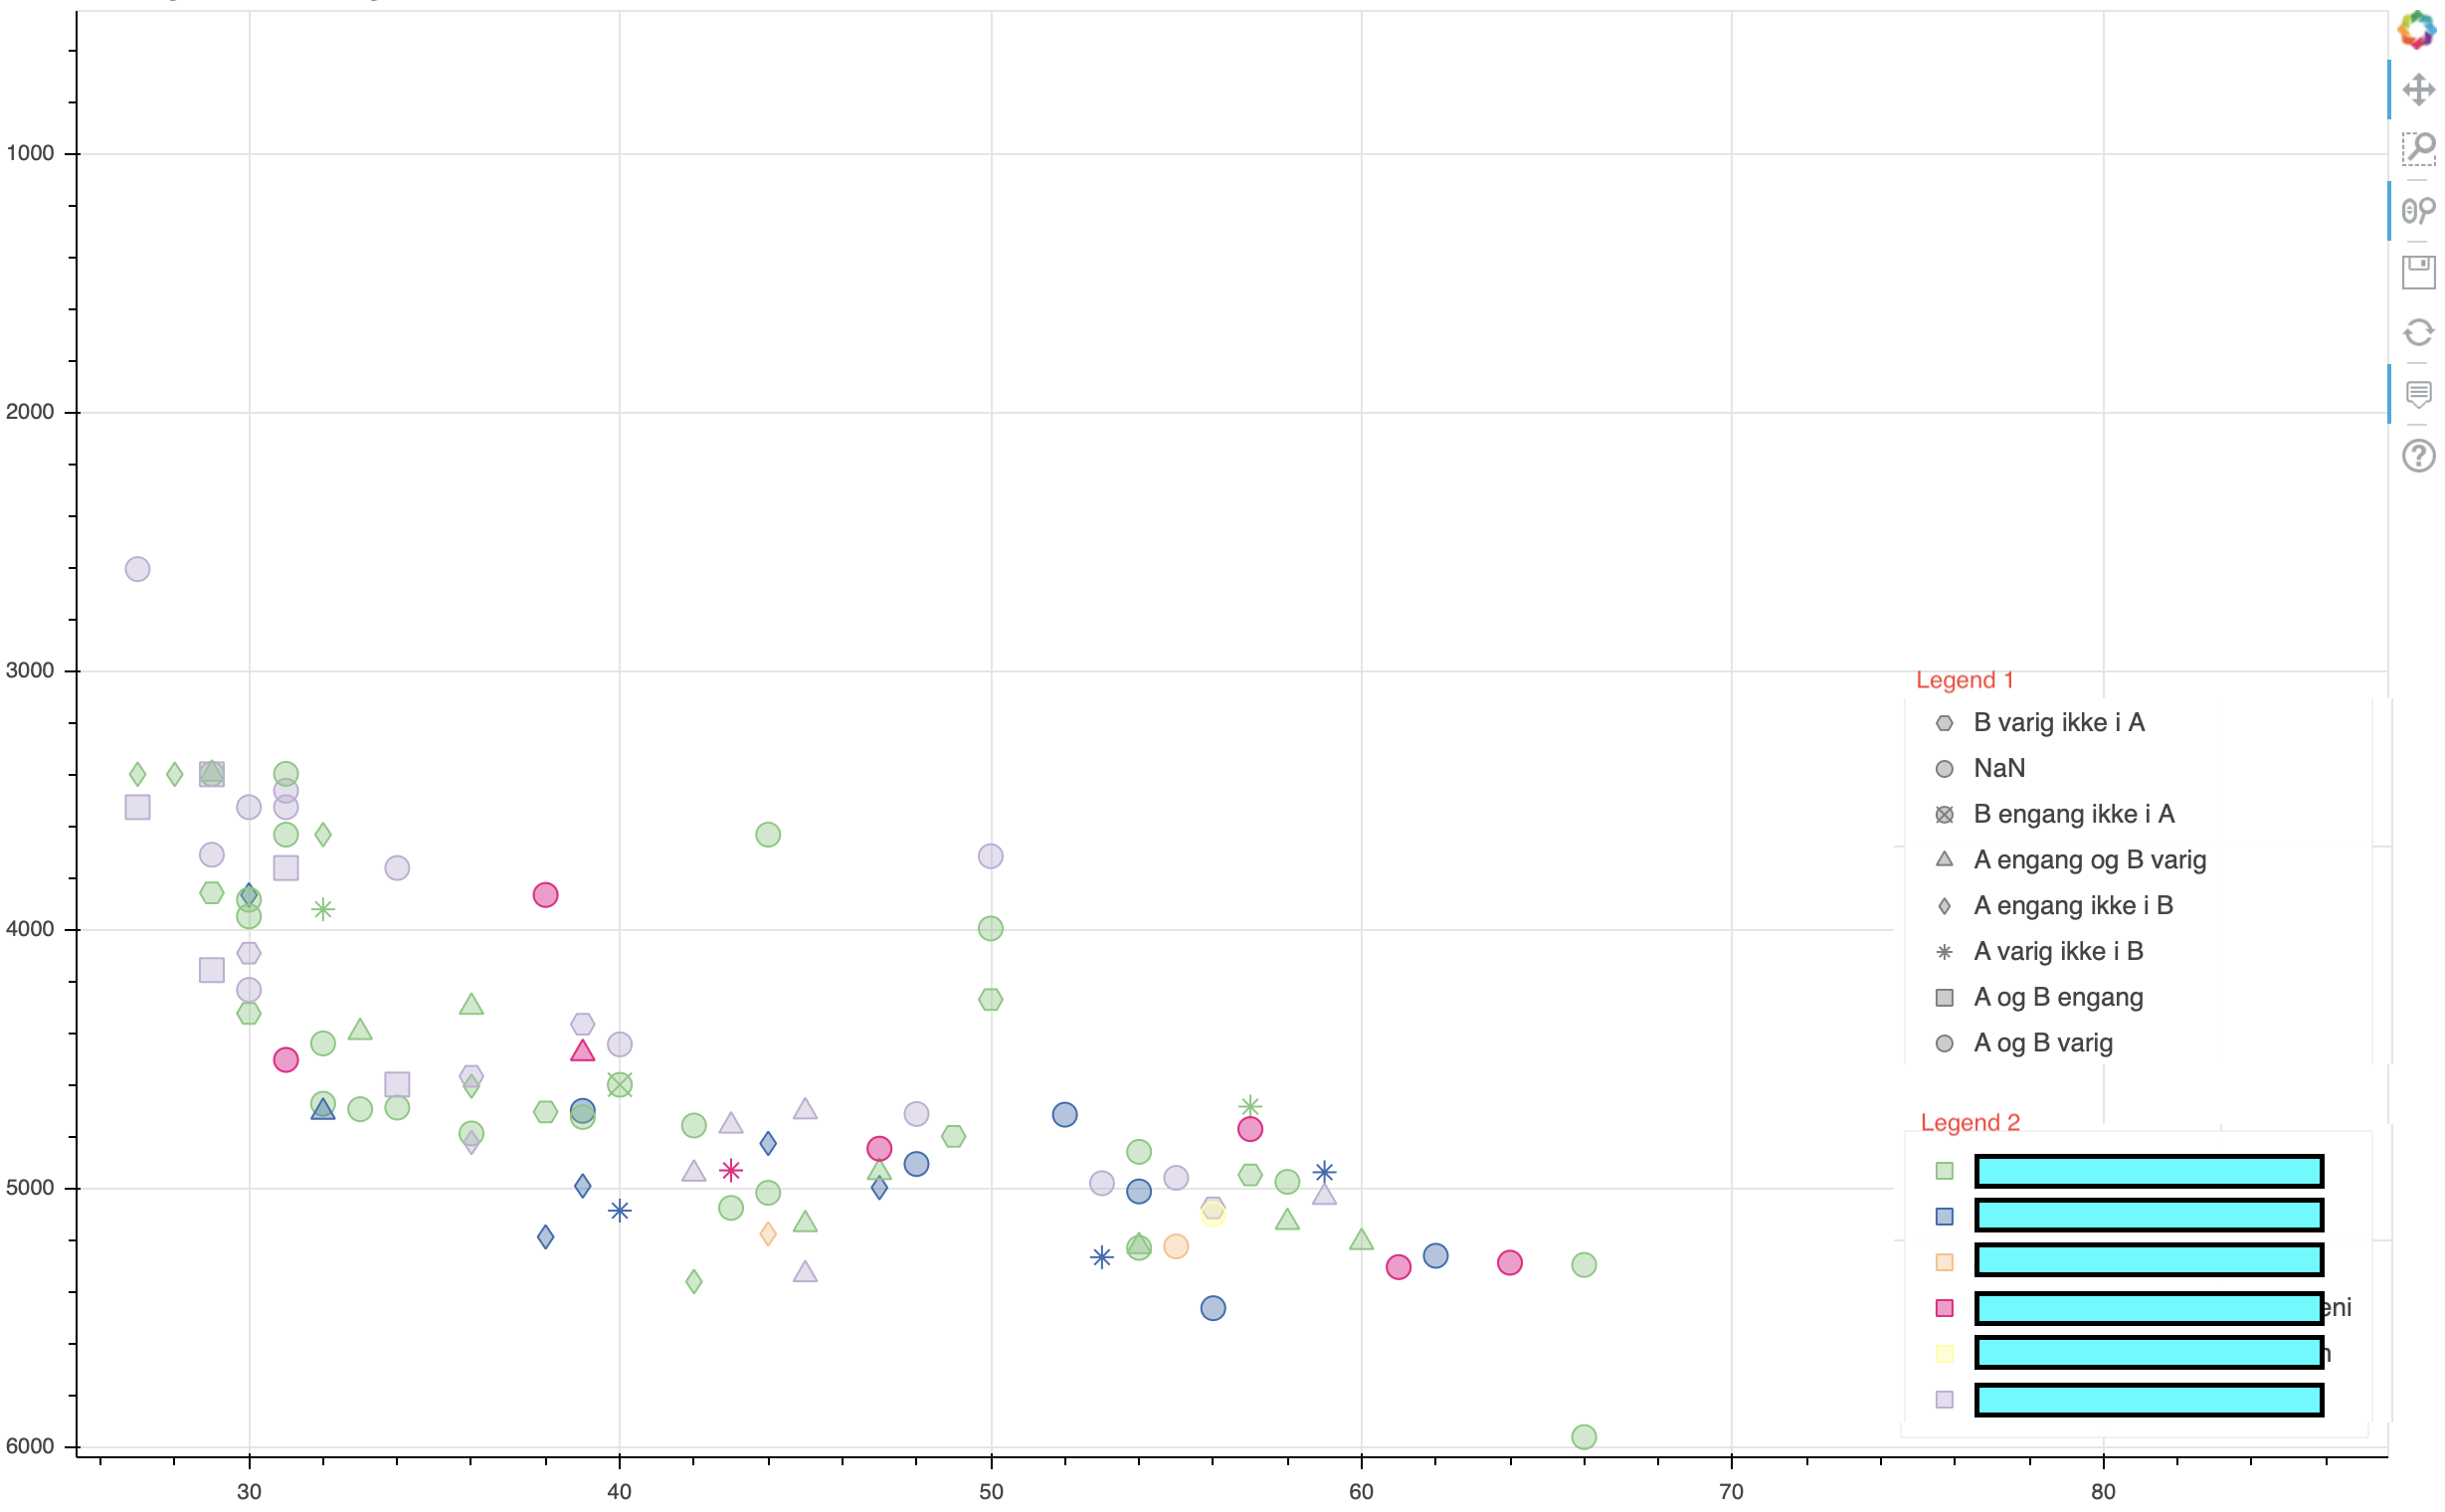
Something like below:


I’m not really sure as to how to do this, but I have tried to create a scatter plot for each category using either a variable color or marker shape. And then afterwards assigning the renderers to a legend and then delete the renderers.

Finally I add a scatter plot where both the color and marker are defined by variables. I would then like to not have the legend for this plot to show up.

Here is the code:

import pandas as pd                                                                             
from bokeh.plotting import figure, output_file, show, save                                      
from bokeh.models import ColumnDataSource, CDSView, GroupFilter, Slope, ColorBar, Legend        
from bokeh.transform import factor_cmap, factor_mark, linear_cmap                               
                                                                                                
output_file(r"./analysis.html")                                                                 
                                                                                                
df = pd.read_csv(r"./sheet.csv", sep=";", decimal=",", thousands=".")                           
                                                                                                
column_list = df.columns.tolist()                                                               
indstillings_type = df["indstillings_type"].unique().tolist()                                   
                                                                                                
# categories                                                                                    
indstillings_type = [x for x in indstillings_type if str(x) != "nan"]                           
AC = ["A", "B", "C", "D", "E", "F"]                                                             
                                                                                                
# Constants                                                                                     
COLORS = ["#7fc97f", "#f0027f", "#386cb0", "#fdc086", "#beaed4", "#ffff99"]                     
MARKERS = ["hex", "circle_x", "triangle", "diamond", "asterisk", "square"]                      
                                                                                                
                                                                                                
# dataframe -> bokeh CDS                                                                        
source = ColumnDataSource(df)                                                                   
                                                                                                
# initialiser figure                                                                            
p = figure(plot_width=1400, plot_height=800, active_scroll="wheel_zoom")                        
                                                                                                
# create two scatterplots. One where the color is decided by one catoegory, and                 
# one where the marker shape is decided by another category                                     
marker = factor_mark("indstillings_type", MARKERS, indstillings_type)                           
color = factor_cmap("Overenskomst", COLORS, AC)                                                 
scatter_color = p.scatter(                                                                      
    "Alder",                                                                                    
    "brutto_korrigeret",                                                                        
    source=source,                                                                              
    legend=color,                                                                               
    fill_alpha=0.4,                                                                             
    size=12,                                                                                    
    marker="square",                                                                            
    color=color,                                                                                
)                                                                                               
scatter_marker = p.scatter(                                                                     
    "Alder",                                                                                    
    "brutto_korrigeret",                                                                        
    source=source,                                                                              
    legend=marker,                                                                              
    fill_alpha=0.4,                                                                             
    size=12,                                                                                    
    marker=marker,                                                                              
    color="grey",                                                                               
)                                                                                               
                                                                                                
# delete the the two above renderers                                                            
p._property_values.pop("renderers")                                                             
                                                                                                
# Add just the legends                                                                          
color_legend = Legend(items=[("Overenskomst", [scatter_color])])                                
marker_legend = Legend(items=[("indstillings_type", [scatter_marker])])                         
                                                                                                
# add the final scatterplot. The goal is to keep the markers, but not the                       
# legend, relying on the two legends from above.                                                
scatter_marker = p.scatter(                                                                     
    "Alder",                                                                                    
    "brutto_korrigeret",                                                                        
    source=source,                                                                              
    fill_alpha=0.4,                                                                             
    size=12,                                                                                    
    marker=marker,                                                                              
    color=color,                                                                                
)
                                         
p.add_layout(color_legend, "left")       
p.add_layout(marker_legend, "right")     
p.legend.location = "bottom_right"       
                                         
save(p)