Hi,
I have an issue where when I press the reset button on my toolbar everything resets, except for the slider.
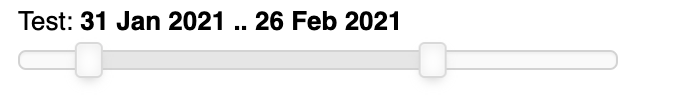
If I change the slider to the settings below (image), the chart changes but if I press the reset toolbar button the slider does not go back to it’s original position
Does anyone know what is going on.
I am running Bokeh 2.1.0
Here is my code for replication.
Thanks
import numpy as np
import bokeh.plotting as bp
from bokeh.models import CustomJS
from bokeh.models.widgets import DateRangeSlider
from bokeh.layouts import row, widgetbox
from bokeh.plotting import figure, show, output_file

df = pd.DataFrame(np.random.randint(0,30,size=(25, 3)), columns=list('ABC'))
df['date'] = pd.date_range('2021-02-01','2021-02-25')
df.index.name ='Numbers'
dt = bp.ColumnDataSource(df)

xmin = df.date.min() - pd.Timedelta(days=1) # set xmin
xmax = df.date.max() + pd.Timedelta(days=1) # set xmax

output_file("Plot.html")

p = figure(title="Example",
       x_axis_label = "Number", y_axis_label = "Temperature in C",
       x_range = (xmin, xmax), x_axis_type = 'datetime')

p.line(source=dt, x='date', y='A', color='blue', legend='Line A')
p.legend.click_policy="hide"

callback = CustomJS(args=dict(p=p), code="""
    var a = cb_obj.value;
    p.x_range.start = a[0];
    p.x_range.end = a[1];
    source.change.emit();
""")

range_slider = DateRangeSlider(start=xmin,
                      end=xmax,value=(xmin,xmax), step=86400000, title="Test")
range_slider.js_on_change('value', callback)

layout = row(p,widgetbox(range_slider))
show(layout)