Hi,
All the current built in axes and grid are are aligned with the underlying canvas, i.e. are only horizontal or vertical. Bokeh could certainly be used to draw a skewed axes and grids, but you'd have to do it "by hand" so to speak, by using glyph methods like line, segment, text, etc to draw grid lines, tick, and tick labels, etc at positions you compute yourself. (Alternatively you could create custom extensions to control the drawing directly from JavaScript).
Thanks,
Bryan
···
On Dec 4, 2017, at 03:47, 'Fabian Braennstroem' via Bokeh Discussion - Public <bokeh@continuum.io> wrote:
Hi,
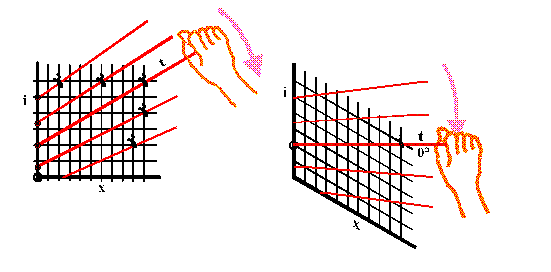
I would like to create a Mollier-diagram, which displays the properties (temperature, absolute and relative humidity, enthalpy and density) of humid air for a given pressure.
For this one needs to rotate one axis by a certain angle (see the picture below). Is this at all possible in bokeh? Maybe, I need to do this directly with the available data!?
Thanks!
Fabian
Moist Air - Transforming the Mollier Diagram to a Psychrometric Chart - or vice versa
http://www.conservationphysics.org/mollier/moll1.php
<image.png>
--
Regards!
Fabian
--
You received this message because you are subscribed to the Google Groups "Bokeh Discussion - Public" group.
To unsubscribe from this group and stop receiving emails from it, send an email to bokeh+unsubscribe@continuum.io.
To post to this group, send email to bokeh@continuum.io.
To view this discussion on the web visit https://groups.google.com/a/continuum.io/d/msgid/bokeh/CAGzVTvKpkK6WcG%2BRuoxaEEHGvyCQvY241M%3DX-enZAh6uq9mivA%40mail.gmail.com\.
For more options, visit https://groups.google.com/a/continuum.io/d/optout\.