☰Read-only archive⌕
Looking for help with Bokeh?

This is a read-only archive. Ask questions and join the conversation on GitHub.

Visit Community Support on GitHub →
Archived discussions · Captured October 28, 2026

Rotating a figure

Community Support
prem
prem

What are you trying to do?

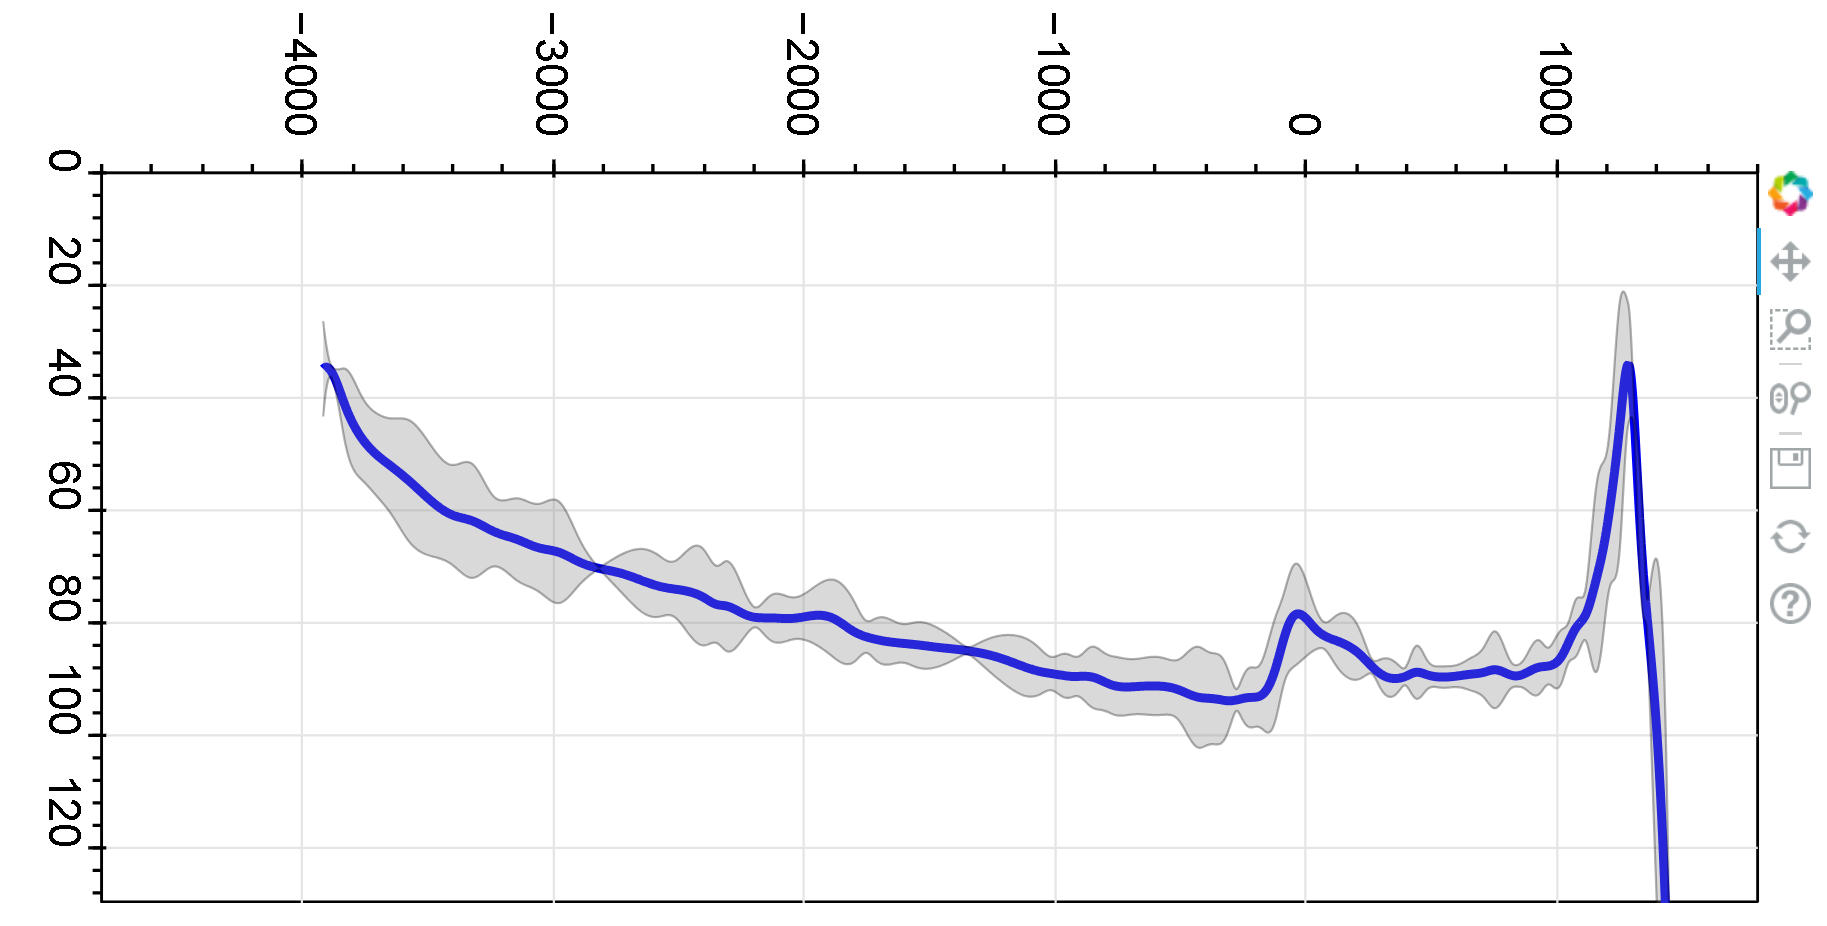
I am trying to rotate an entire bokeh figure including the axis, labels. My output currently looks like this:

I need it to rotate the entire image anti clockwise by 90 degrees. I am trying to figure if there is a way to save this image as HTML image source and then rotate it by modifying html code. Are there other ways to do this in bokeh itself?

⌁   Link to post
Bryan
Bryan

am trying to figure if there is a way to save this image as HTML image source and then rotate it by modifying html code.

Bokeh can output PNGs from Python code, and there are probably CSS transformation that can rotate those images, if you include them in some HTML yourself. But “live” Bokeh plots embedded in HTML are not images, they data plus actual JavaScript code that gets executed to render the data on an HTML canvas. [1]

Are there other ways to do this in bokeh itself?

Yes, you can swap what you plot for “x” vs “y”.


  1. Maybe there are CSS mechanisms for rotating HTML canvas elements, I don’t actually know. But you’d have to muck around with what are normally internal parts of Bokeh plots to try to do that, so YMMV and just being clear that would be totally unsupported usage, even if it works in some fashion. ↩︎

⌁   Link to post
prem
prem

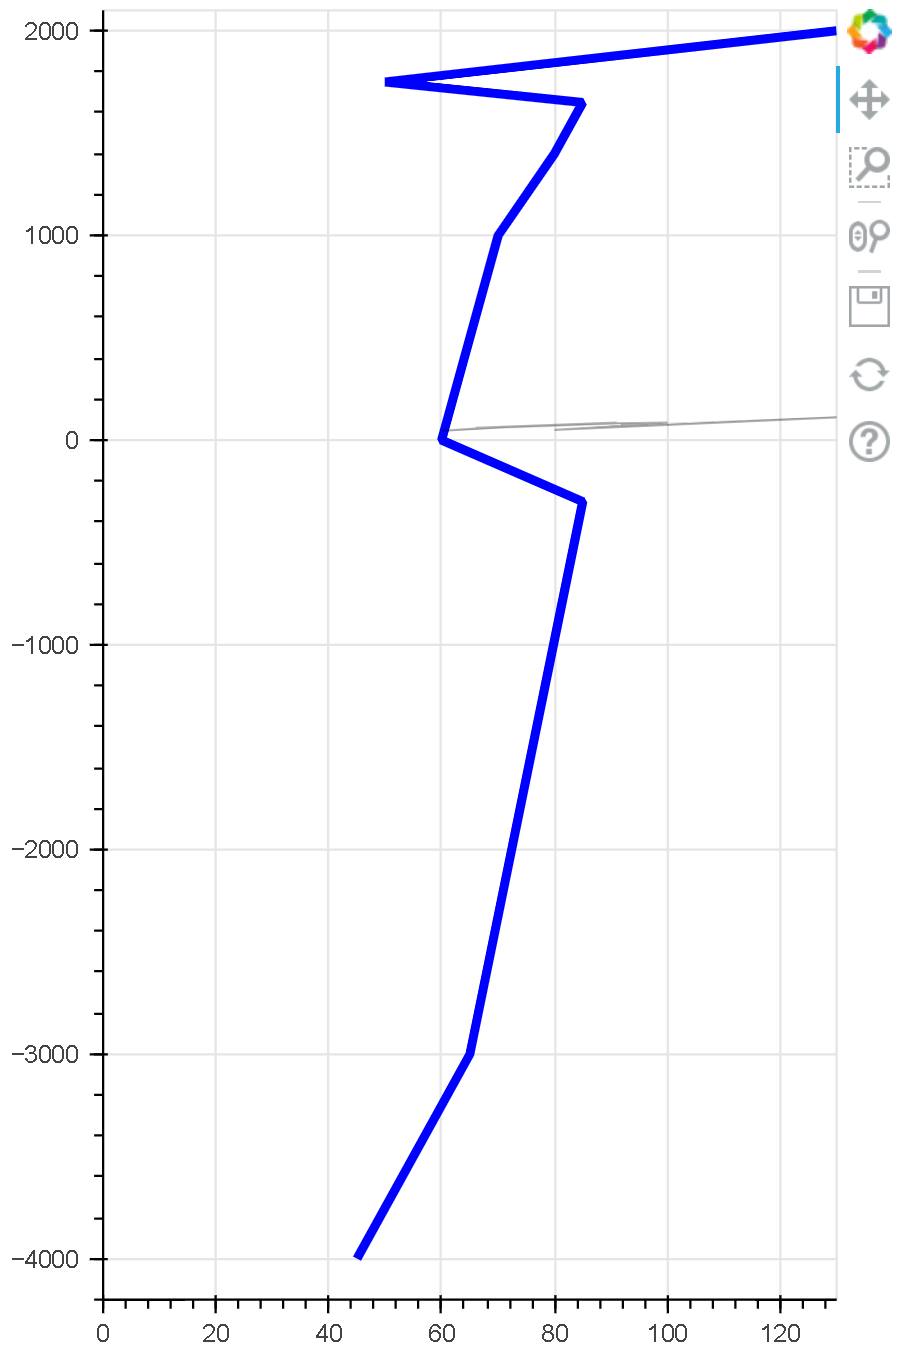
I can swap the x and y for the line plot, no problem. It is the band that is a problem though. In this dataset, if I swap the ‘x’ and ‘y’, the ‘y’ is no more a function of ‘x’, it’s just a relation. That seems to preclude making a band.

⌁   Link to post
prem
prem

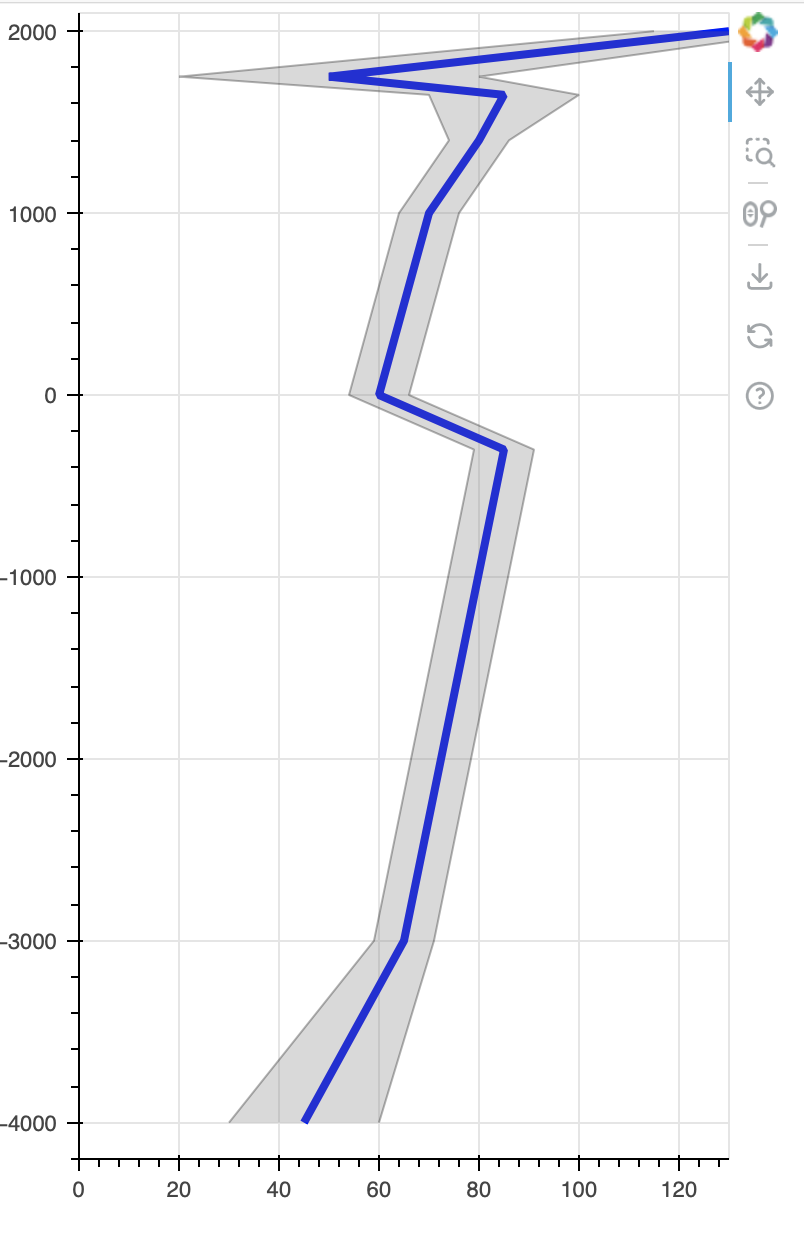
That’s great to hear! Rotating the band is the clean solution I am looking for. Here is a code snippet:

import numpy as np
import pandas as pd
from bokeh.plotting import figure
from bokeh.models import ColumnDataSource, Band
from bokeh.io import show 

# Make some simple data
height = np.array([2000.0, 1750.0, 1650.0, 1400.0, 1000.0, 0.0, -300.0, -3000.0, -4000.0])
mean = np.array([130.0, 50., 85.0, 80.0, 70.0, 60.0, 85.0,  65.0, 45.0])
std = np.array([5.0, 10.0, 5.0, 2.0, 2.0, 2.0,  2.0, 2.0, 5.0])
data = pd.DataFrame(np.transpose([height, mean, std]), columns=['Height', 'Mean', 'Std'])
data['Upper'] = data['Mean'] + 3*data['Std']
data['Lower'] = data['Mean'] - 3*data['Std']

# Make a basic bokeh plot
s = figure(plot_width=400, plot_height=600,x_range=[0,130], y_range=[-4200, 2100])
data_source = ColumnDataSource(data)

# Create a plot with 'Mean' in X and 'Height' in Y axis. Note that the independent variable is actually 'Height'
plot = s.line(x='Mean', y='Height', line_color='blue', line_alpha=1.0, line_width=4, source=data_source)

# Add a band; the intention here is to create a confidence interval at each 'Height' value. 'Height' is in X axis. 
# The band below will not create a plot that I am looking for
band = Band(base="Mean", lower="Lower", upper="Upper", source=data_source, fill_alpha=0.3, fill_color="gray", line_color="black")
s.add_layout(band)        
show(s)

⌁   Link to post
Bryan
Bryan

Also just noting that there is a decent chance in the near future the the Band annotation is deprecated and instead simpler separate plot.vband and plot.hband glyphs are added.

⌁   Link to post

End of archived discussion · Replies are disabled