Secondary axis and scale problems

Hi, trying to understand this behaviour.

I have 2 sources that share the same x axis range but their y values are drastically different. The actual values being plotted will be changing dynamically, so essentially what I’m after is for both axes ranges to “follow” the respective min/max range of the renderers assigned to them. What I’m noticing is that the primary (i.e. left) axis will, by default at least, “auto” scale not only to the renderer that’s being plotted on it, but to all the renderers. Compounding this, I can’t seem to figure out how to get the secondary (i.e. right) axis to follow the right renderer’s min/max values at all. I’ve played with the bounds property, and read about the “follow”/“follow_interval” properties as well but don’t really understand their usage/am unsure if/how they apply here.

I know I could just go nuclear and write my own CustomJS to do what I want here but wondering if something is built in that I’m completely missing?

Finally, the other thing that’s related to this: I’d like to be able to wheelzoom in on one y axis without that zoom applying to the other y axis. Need a way to “delink” the two from each other…

Sandbox example code:

from bokeh.plotting import figure, show
from bokeh.models import Scatter, Rect, ColumnDataSource, Range1d, LinearAxis

s_src = ColumnDataSource({'x':[1,2,3],'y':[1,2,3]})
r_src = ColumnDataSource({'x':[1,2,3],'y':[100,200,300]})

f = figure()
#could add start and end args to the Range1d here... but that would fix my right axis bounds (don't want that), and my left axis range would STILL follow the 'right' renderer
#so i don't think there's anything to do here?
f.extra_y_ranges={'r':Range1d()} 
f.add_layout(LinearAxis(y_range_name='r'),'right')

sg = Scatter(x='x',y='y')
sr = f.add_glyph(s_src,sg)

rg = Rect(x='x',y='y',height=10,width=0.5)
rr = f.add_glyph(r_src,rg,y_range_name='r')
show(f)

As always thanks so much!

What I’m noticing is that the primary (i.e. left) axis will, by default at least, “auto” scale not only to the renderer that’s being plotted on it, but to all the renderers.

The DataRange1d has a renderers property you can set, it should be a list of the renderers you want to auto-range for (if unset, defaults to all available renderers, as you have noted).

I can’t seem to figure out how to get the secondary (i.e. right) axis to follow the right renderer’s min/max values at all.

You could try setting renderers on the range for the secondary axis (to different renderers), in the same way as above, but I have to warn that multiple data-ranges for multiple axes is not well-trodden ground. I cannot promise it will work. All of the examples I am aware of use simple manual start / end.

1 Like

Oh man, I had typed a long response questioning the use of the DataRange1d model and found the answer along the way :slight_smile:

Trick is to assign a DataRange1d, NOT a Range1d model to the extra_y_ranges. I did not understand that that was even possible (is that even documented anywhere/is it in examples?)! Then, create your renderers and tell the renderers what axis to plot on, THEN you assign the renderers back to the DataRange1d object to tell it what to “follow”.

Check it out:

from bokeh.layouts import layout
from bokeh.plotting import figure, show, save
from bokeh.models import Scatter, Rect, ColumnDataSource, Range1d, LinearAxis, DataRange1d, Slider,CustomJS


sdict = {0:{'x':[1,2,3],'y':[1,2,3]}
         ,1:{'x':[1,2,3],'y':[2,3,4]}
         ,2:{'x':[1,2,3],'y':[3,4,5]}}

rdict = {0:{'x':[1,2,3],'y':[100,200,300]}
         ,1:{'x':[1,2,3],'y':[1000,2000,3000]}
         ,2:{'x':[1,2,3],'y':[3000,4000,5000]}}

s_src = ColumnDataSource(sdict[0])
r_src = ColumnDataSource(rdict[0])

f = figure()

#create the second axis with an empty DataRange1d
f.extra_y_ranges={'r':DataRange1d()} 
f.add_layout(LinearAxis(y_range_name='r'),'right')

#first axis renderer
sg = Scatter(x='x',y='y')
sr = f.add_glyph(s_src,sg)
#Tell the primary y_range to "follow" the sr renderer only
f.y_range.renderers=[sr]

#second axis renderer, and tell it to plot on the 'r' y_range_name
rg = Rect(x='x',y='y',height=10,width=0.5)
rr = f.add_glyph(r_src,rg,y_range_name='r')

#THEN, now that that renderer is instantiated, tell the y_range['r'] to follow it
f.extra_y_ranges['r'].renderers=[rr]

#simple slider example to move the plotted data ranges around on both renderers
sl = Slider(start=0,end=len(sdict.keys())-1,value=0)

cb = CustomJS(args=dict(s_src=s_src,sdict=sdict
                        ,r_src=r_src,rdict=rdict
                        ,sl=sl)
              ,code='''
              s_src.data = sdict[sl.value]
              r_src.data = rdict[sl.value]
              s_src.change.emit()
              r_src.change.emit()
              
              ''')
sl.js_on_change('value', cb)
lo = layout([f,sl])

save(lo,'dummy.html')
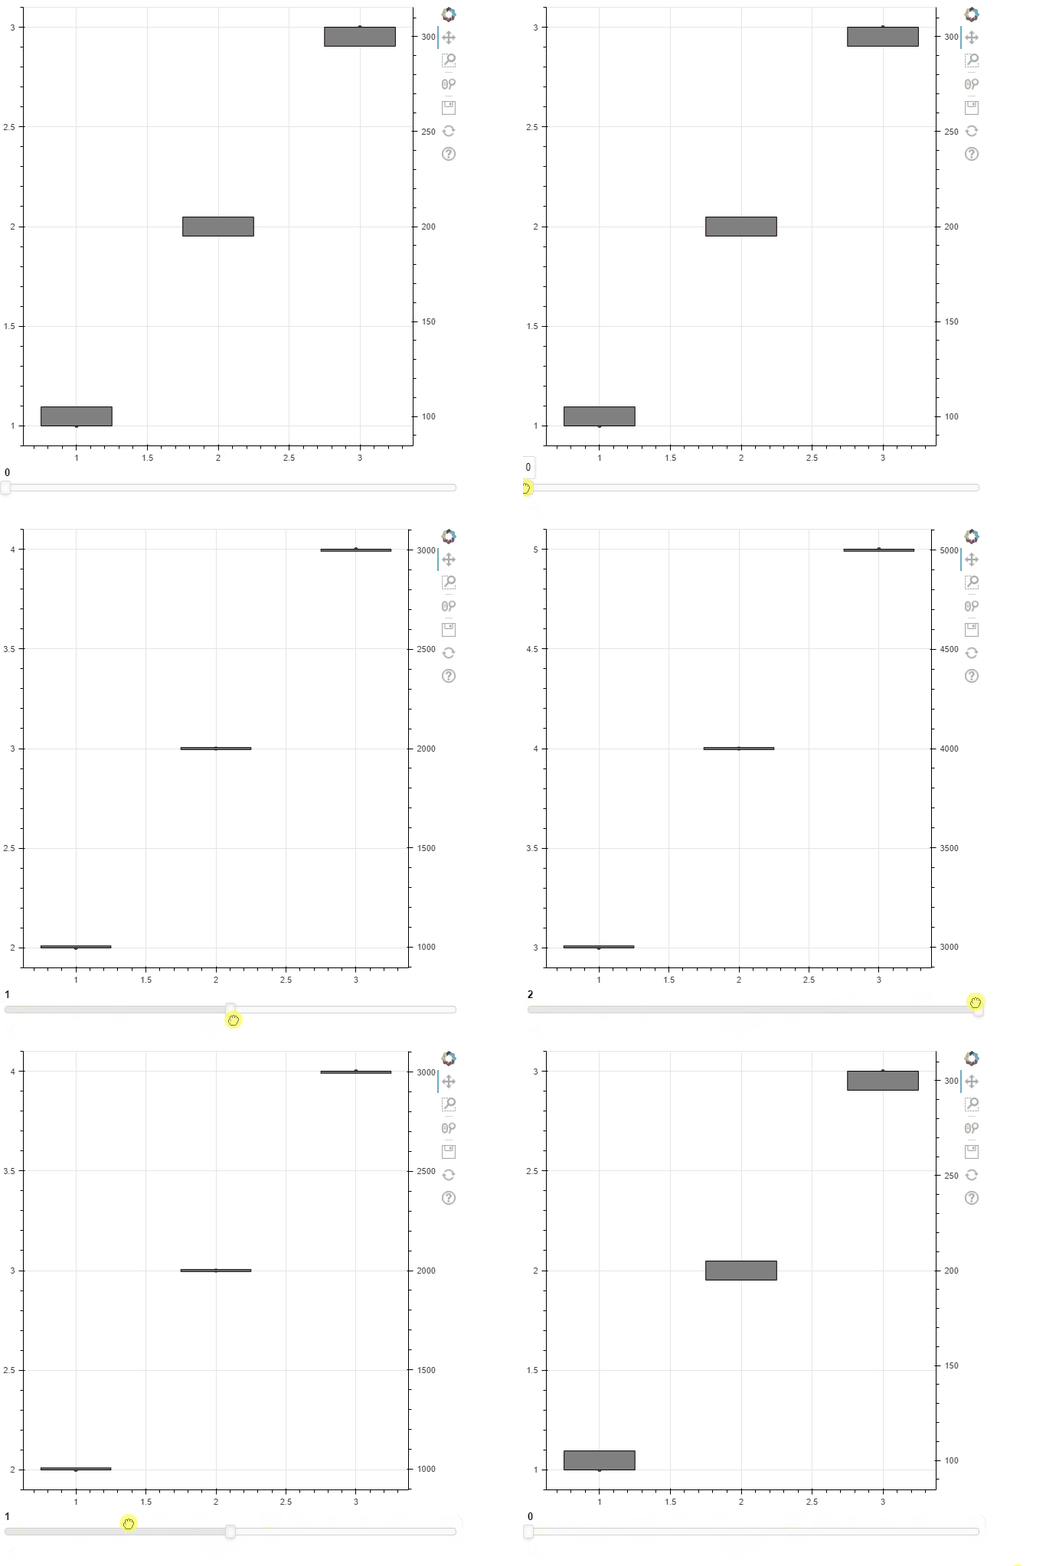
ranges

It totally works. LOVE IT.

Last piece still unanswered: Is there a way to wheelzoom in on one y axis without that zoom applying to the other y axis (i.e. control them one at a time). Need a way to “delink” the two from each other…

Thanks so much for the tips/clues, it helps so much.

1 Like

No demonstration that I am aware. It’s documented implicitly in the sense that the specified types allow for any Range subtype to be configured (at least, in principle).

An upside of a highly modular, composable system is that the individual components can be tested and documented in isolation, while being combinable in myriad ways by users to achieve many things. A downside is there an enormous combinatorial explosion of possibilities (millions, easily), such that it will never be possible to demonstrate them all. Worse yet, there will be some combinations that just don’t make sense / can’t possibly work together, and it is difficult to give meaningful feedback about that ahead of time. Still, the tradeoffs work work in favor of composability (and letting others build higher level, tighter abstractions if they desire).

Need a way to “delink” the two from each other…

Not presently. Currently any extra ranges/axes always automatcally update to preserve the original relative scale between it and the main axis, as determined at the time of first rendering. There is no way to turn this behavior off. I thought there was a GitHub issue about loosening this restriction, but I was not able to find it.

1 Like

This topic was automatically closed 90 days after the last reply. New replies are no longer allowed.