☰Read-only archive⌕
Looking for help with Bokeh?

This is a read-only archive. Ask questions and join the conversation on GitHub.

Visit Community Support on GitHub →
Archived discussions · Captured October 28, 2026

Secondary Y-Axis

Community Support
coyne44
coyne44

Hello,

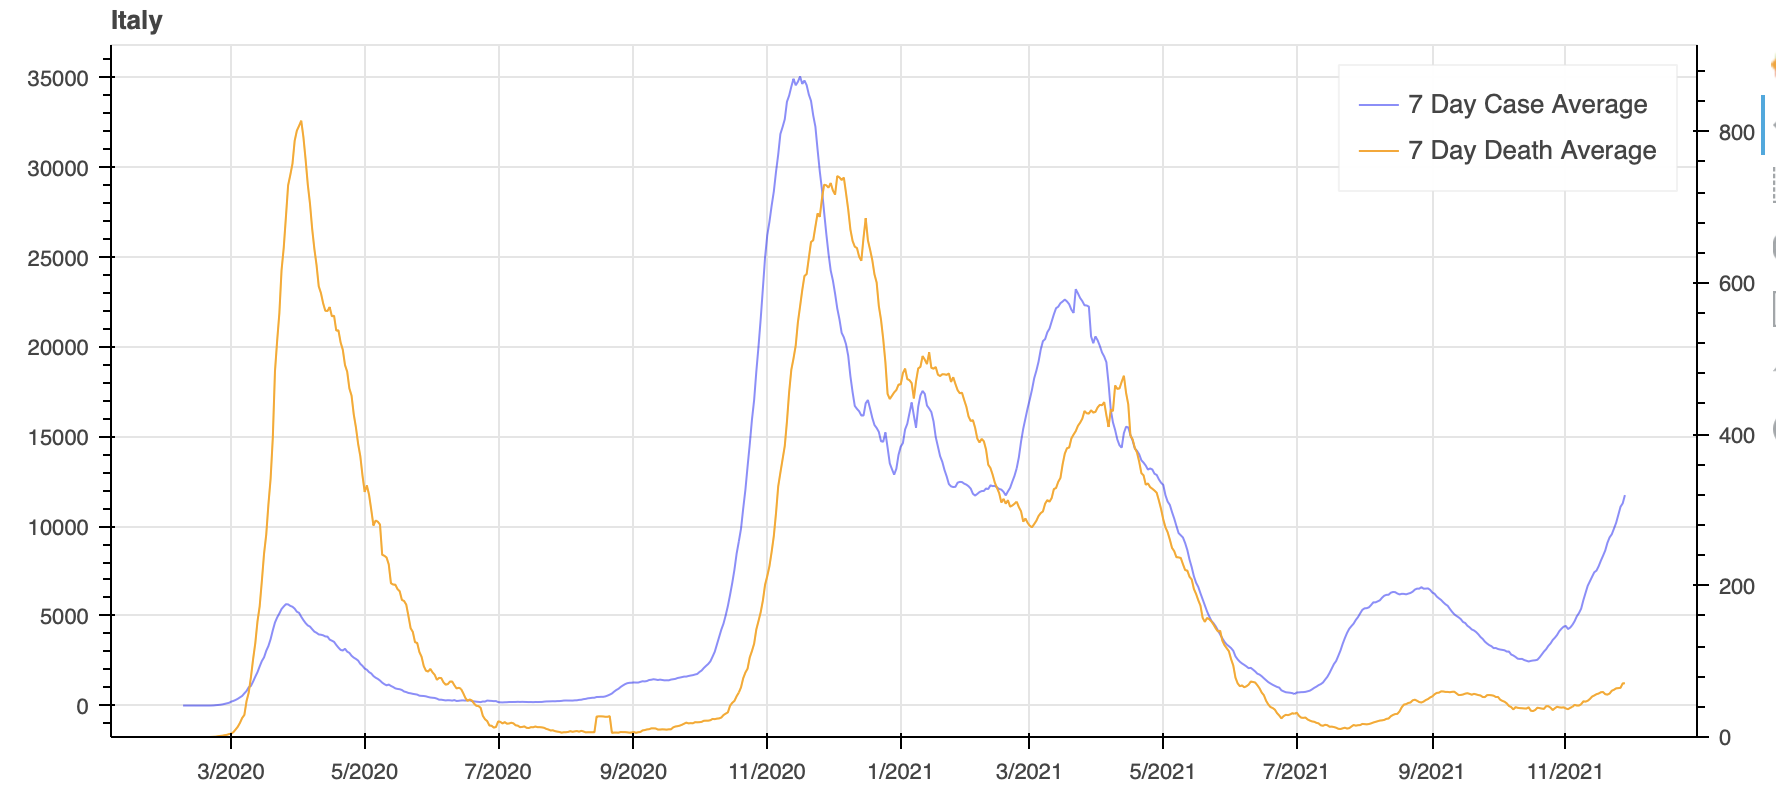
I am making a plot with two line graphs and using a secondary y-axis. However, the primary y-axis on the left automatically puts 0 slightly above the bottom of the graph where the secondary y-axis puts 0 on the very bottom of the graph.

Here is my code:

x = list(europe[europe.location == coun][‘datetime’].iloc[-660:])
y = list(europe[europe.location == coun].iloc[-660:].new_cases_smoothed)
y2 = list(europe[europe.location == coun].iloc[-660:].new_deaths_smoothed)

us = figure(title=coun, plot_height=400, plot_width=1000, x_axis_type="datetime", min_border = 10)


us.line(x, y, color="blue", legend_label="7 Day Case Average", alpha=0.45)
us.extra_y_ranges = {"foo": Range1d(start=-10, end=europe[europe.location == coun]
                                    .iloc[-660:].new_deaths_smoothed.max() + 100)}
us.line(x, y2, color="orange", y_range_name="foo", legend_label="7 Day Death Average")
us.add_layout(LinearAxis(y_range_name="foo"), 'right')
us.xaxis.ticker.desired_num_ticks = 15
us.legend.location = "top_left"

So you can manipulate this with the start parameter for Range1d but that is pretty cumbersome when making multiple plots. Is there any way to automatically put 0 for both y-axises at the same level?

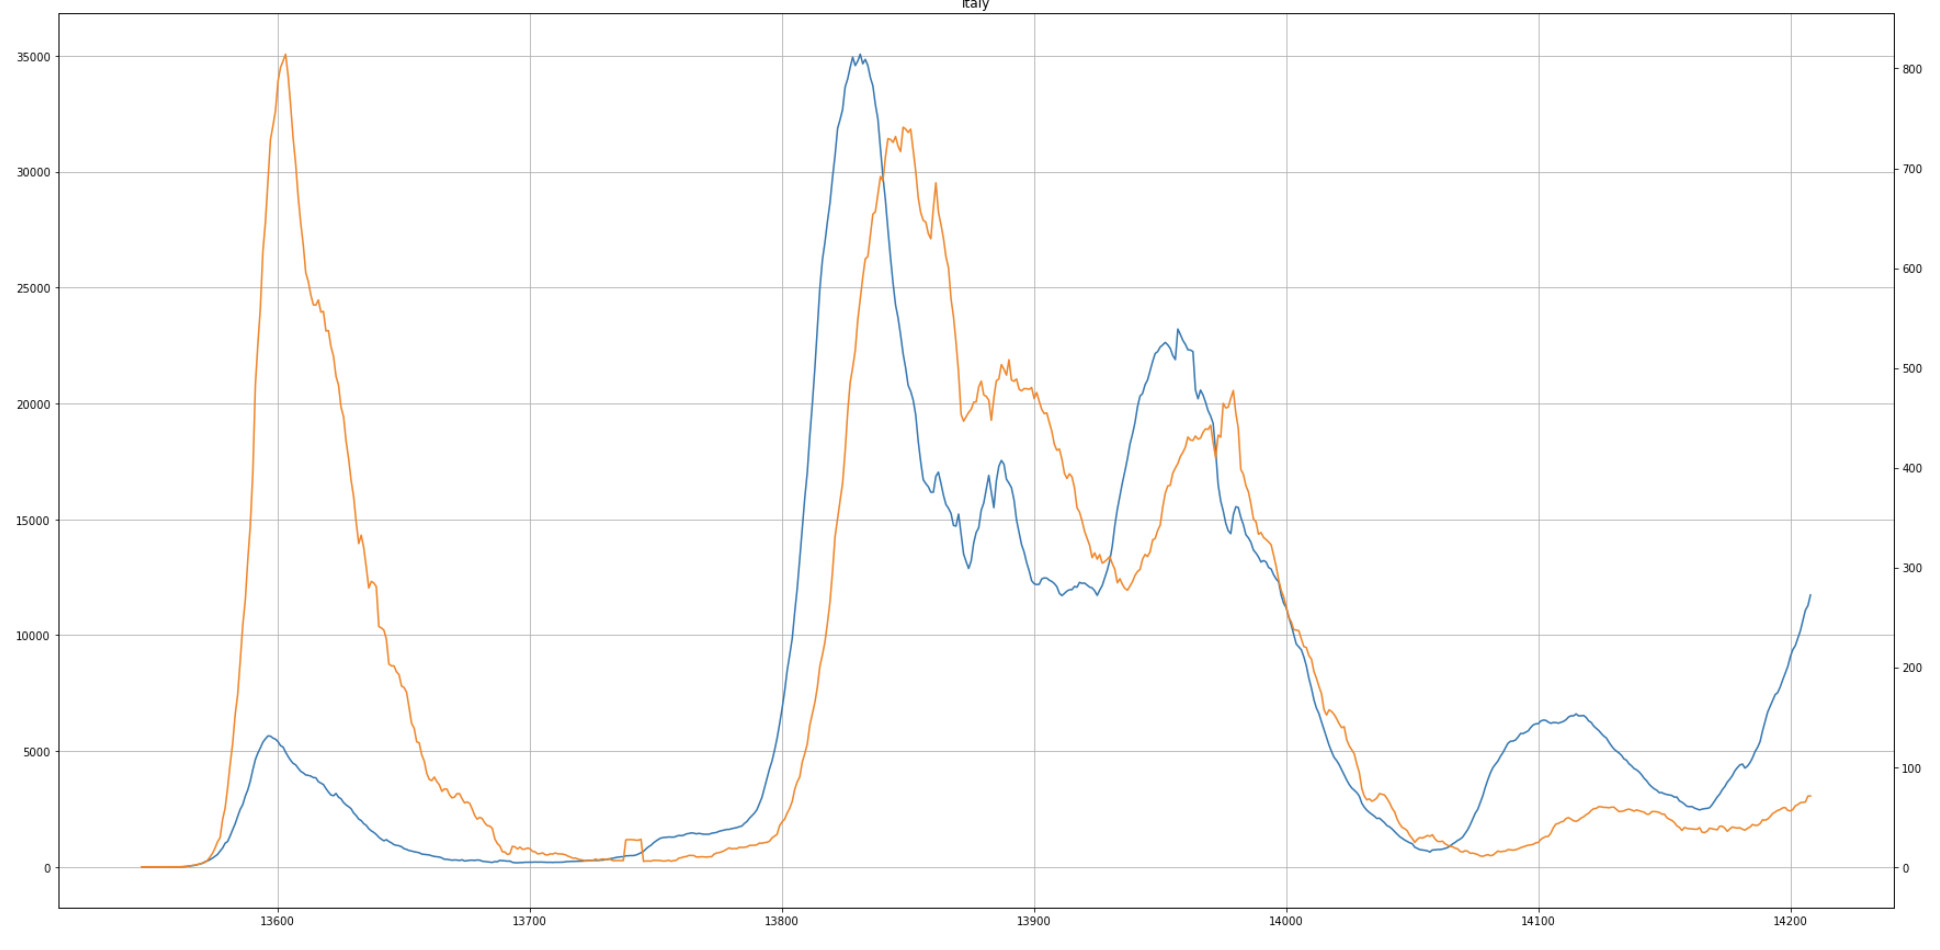
Here is an expample.
Thank you!
Andrew

⌁   Link to post
Bryan
Bryan

@coyne it’s still really unclear if you want both range starts to be exactly zero or whether you want the range starts to be based on the line data, but with the same padding

If it’s the latter, I think your only option is zero range padding, since range padding is a function of the range length. The same padding percentage means a different physical length (in pixels) unless both ranges coincidentally contrive to be exactly the same start/end.

If it is the former, did you try my suggestion above? I.e. only setting start=0 on two data ranges?

⌁   Link to post
coyne44
coyne44

@Bryan,

Apologize for the confusion. I do not want the range start to be 0, but to have the same padding so the graphs are not offset. Please see example.

Matplotlib does this automatically so I thought there might be a way to do it with bokeh. It seems like the best way to do this is possibly use a start value for the secondary axis that is a percentage of the total range, ex. start = (-0.05 * range).

Thanks for you help!

⌁   Link to post
Bryan
Bryan

I do not want the range start to be 0, but to have the same padding

I don’t thinks there is any solution for this. Since the ranges are not the same scale, the only way to ensure the same padding (in pixels) is to set the padding to zero. If you don’t want to do that, I think you will have to explicitly set the start on the ranges to both be the zero, or else just “eyeball” separate values that are “close”.

⌁   Link to post
Bryan
Bryan

FWIW anchoring twin axes together at a common point seems like a reasonable thing, but you are in fact the first person to ever ask about it. You can make a GitHub Issue but I can’t make any promises about anything soon. MPL has the luxury of generating static output mostly. Due to the huge intersection of interactive considerations, ranges/axes are 100% the most complex, complicated, convoluted code in all of Bokeh. Adding even more to that would need a lot of +1’s to justify the effort.

⌁   Link to post
coyne44
coyne44

@Bryan,

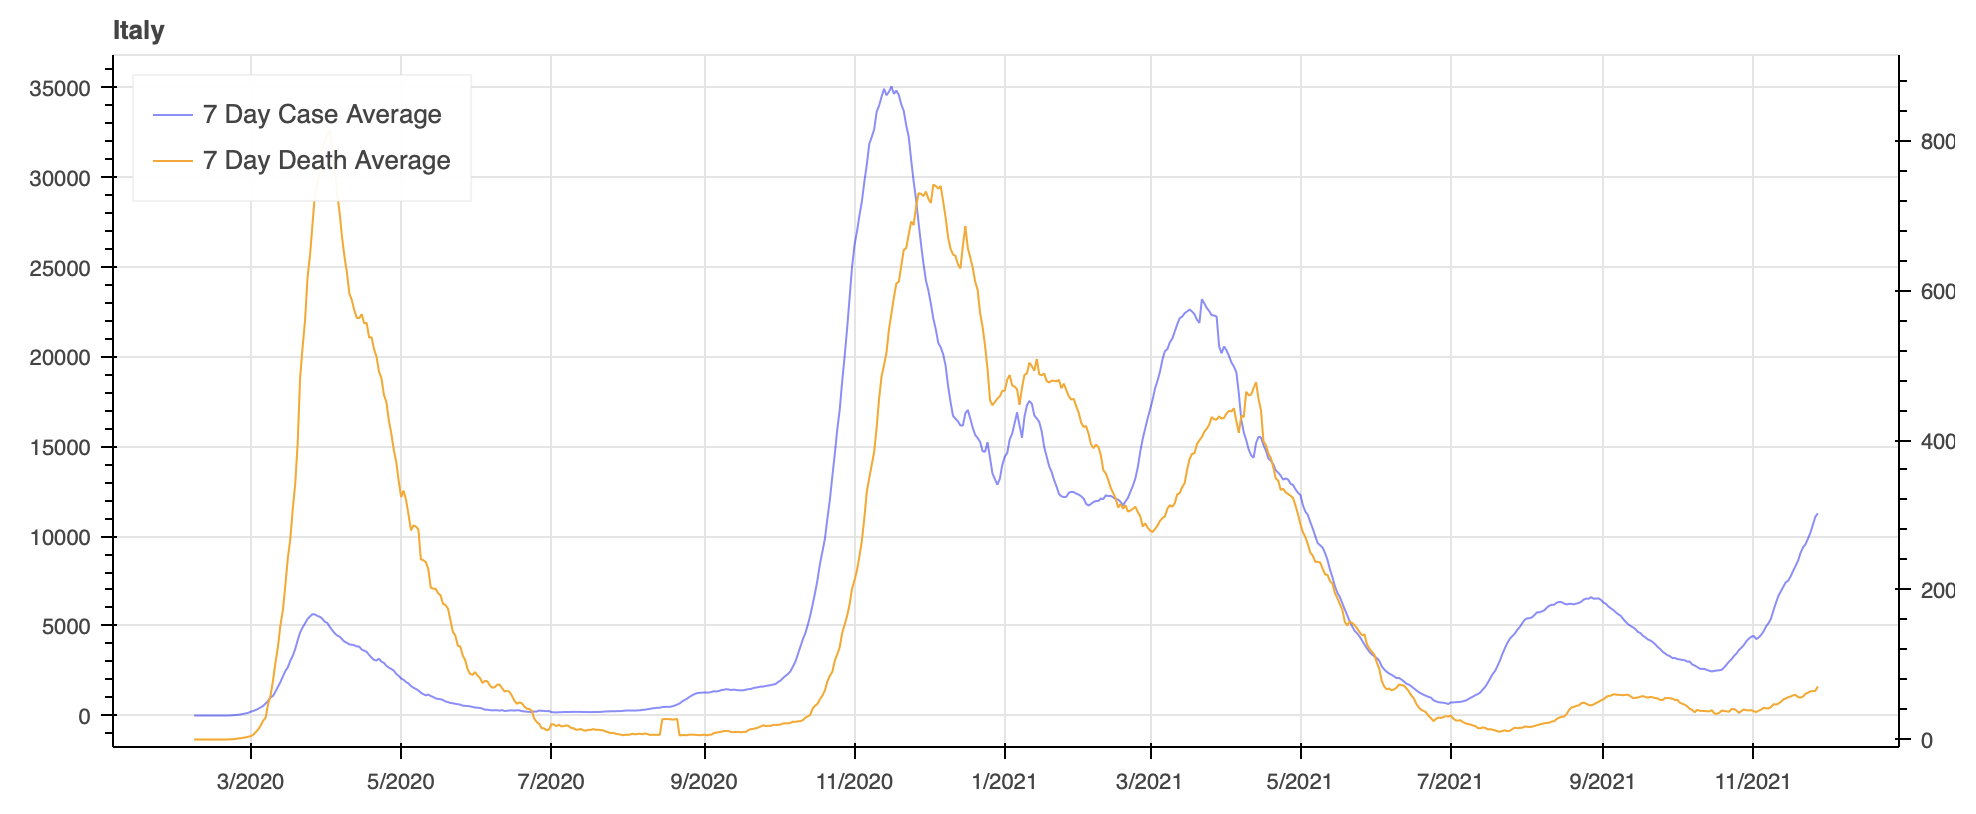
I changed the start and end values of secondary y-axis to both be multiples of the y-range (variables start and end below) and now they are lining up as I wanted.

x = europe[europe.location == coun]['datetime'].iloc[-660:]
y = europe[europe.location == coun].iloc[-660:].new_cases_smoothed
y2 = europe[europe.location == coun].iloc[-660:].new_deaths_smoothed

us = figure(title=coun, plot_height=400, plot_width=900, x_axis_type="datetime", min_border = 10)

start = -.05 * (y2.max() - y2.min())
end = 1.05 * (y2.max() - y2.min())

us.line(x, y, color="blue", legend_label="7 Day Case Average", alpha=0.45)
us.extra_y_ranges = {"foo": Range1d(start=start, end=end)}
us.line(x, y2, color="orange", y_range_name="foo", legend_label="7 Day Death Average")
us.add_layout(LinearAxis(y_range_name="foo"), 'right')
us.xaxis.ticker.desired_num_ticks = 15
us.legend.location = "top_left"

That should be a good enough fix for what I am wanting to do. Thanks for you all your quick replies and solutions!

Andrew

⌁   Link to post

End of archived discussion · Replies are disabled