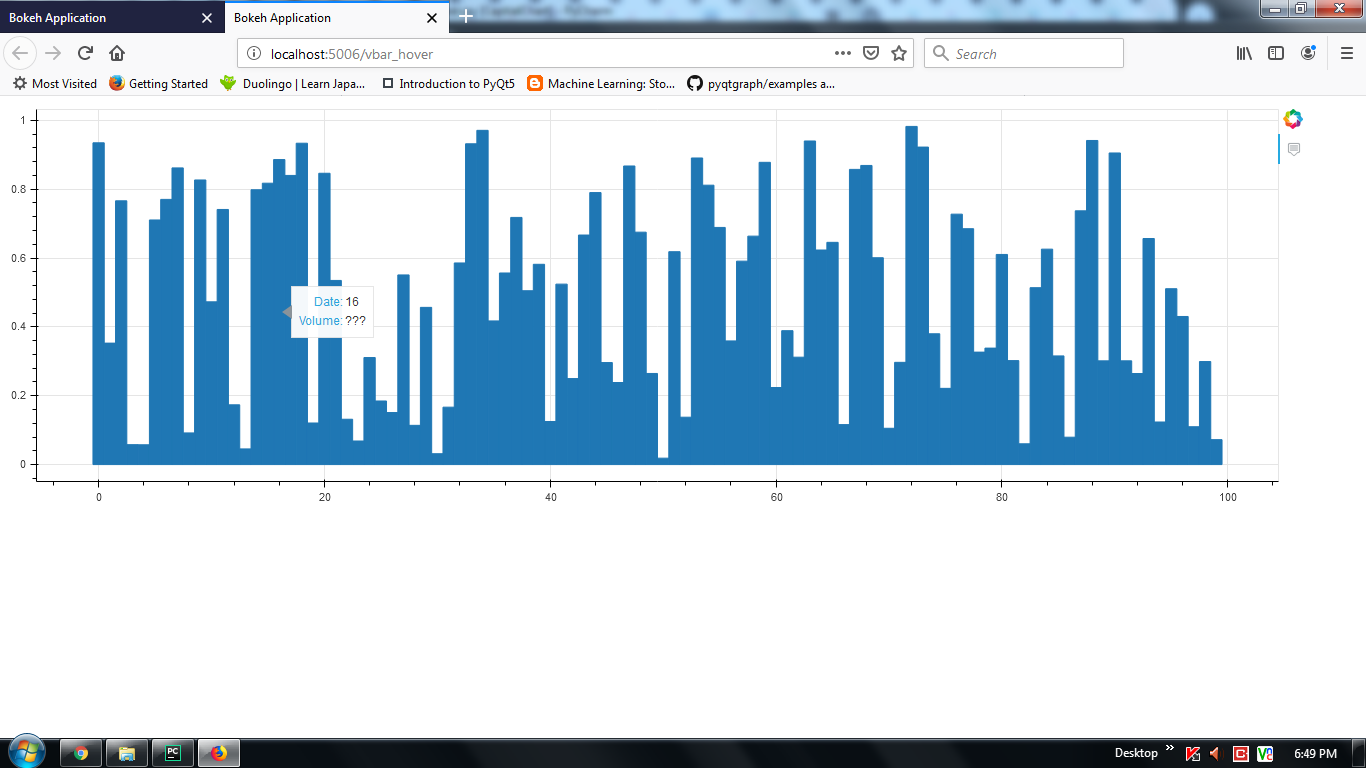
Hover tool is not working properly on vbar graphs. it display only values of x-axis, for y-axis value it show “???”. Below i have given my code, kindly point out me where i am going wrong?
The @foo fields refer to the name of a column in a ColumnDataSource, e.g. source.data['foo'] However, you are not actually doing anything with the CDS you create above. Instead of passing it to vbar and using column names, you are passing literal arrays/lists to directly vbar. This causes the vbar to create an internal CDS to use, with default column names. In this case, the default column names are "x" and "top", matching the glyph parameters. But in particular, note there is no "y", which is why @y finds nothing to display. So you have two options:
change the call to vbar to actually use the source you made, so @y works:
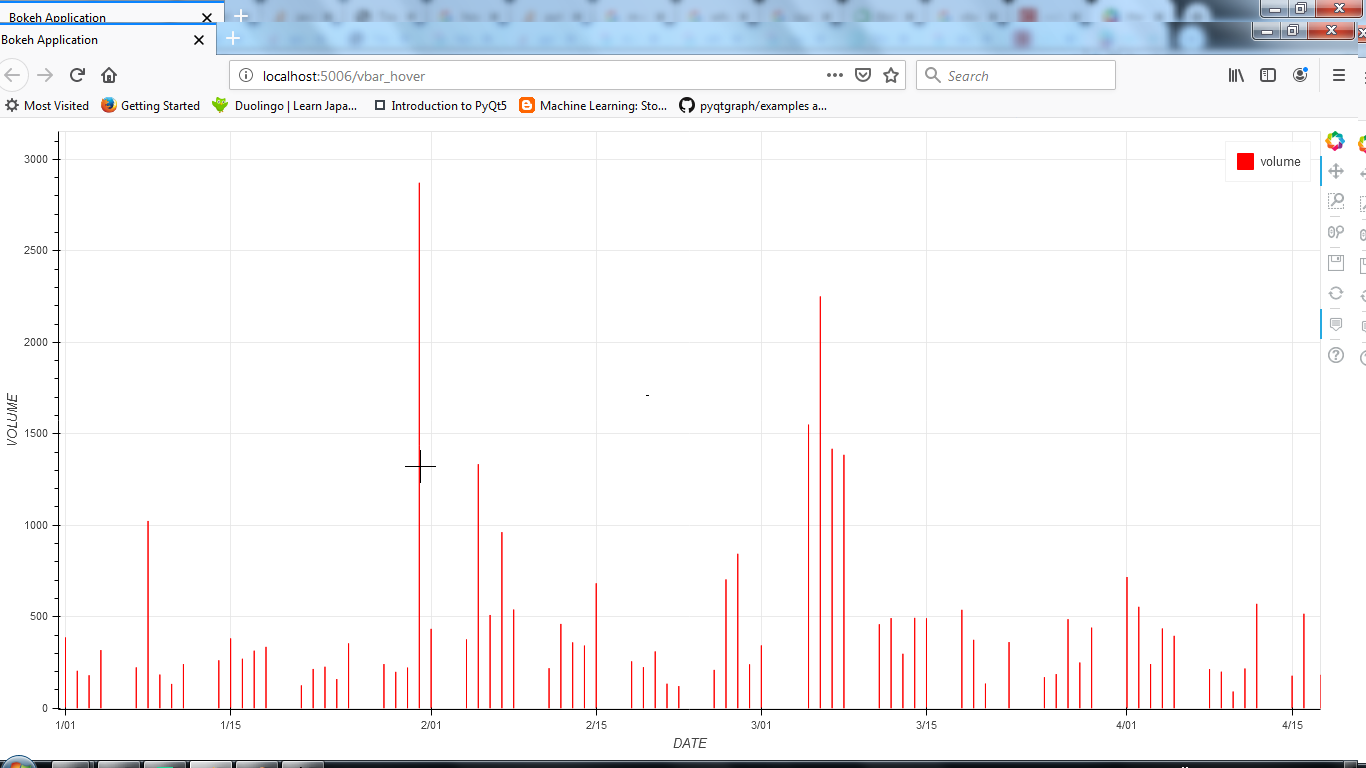
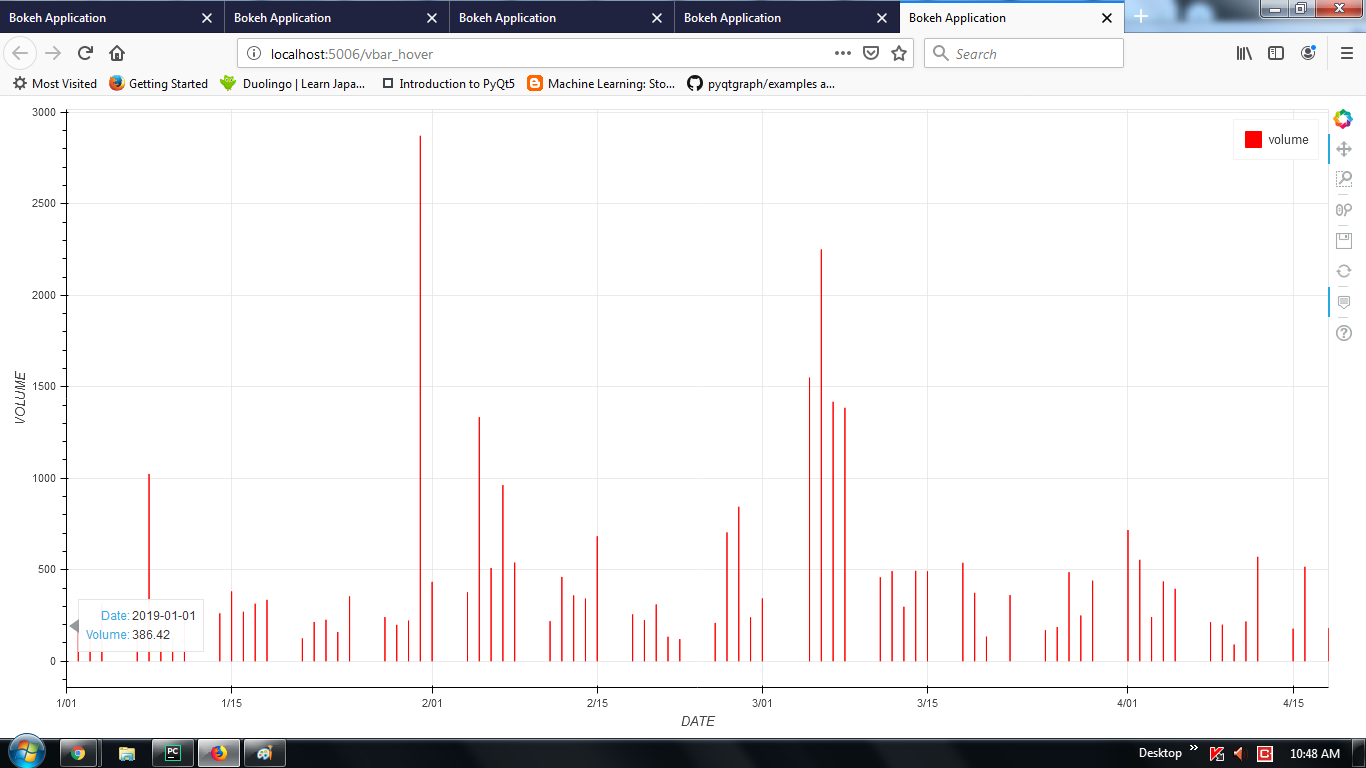
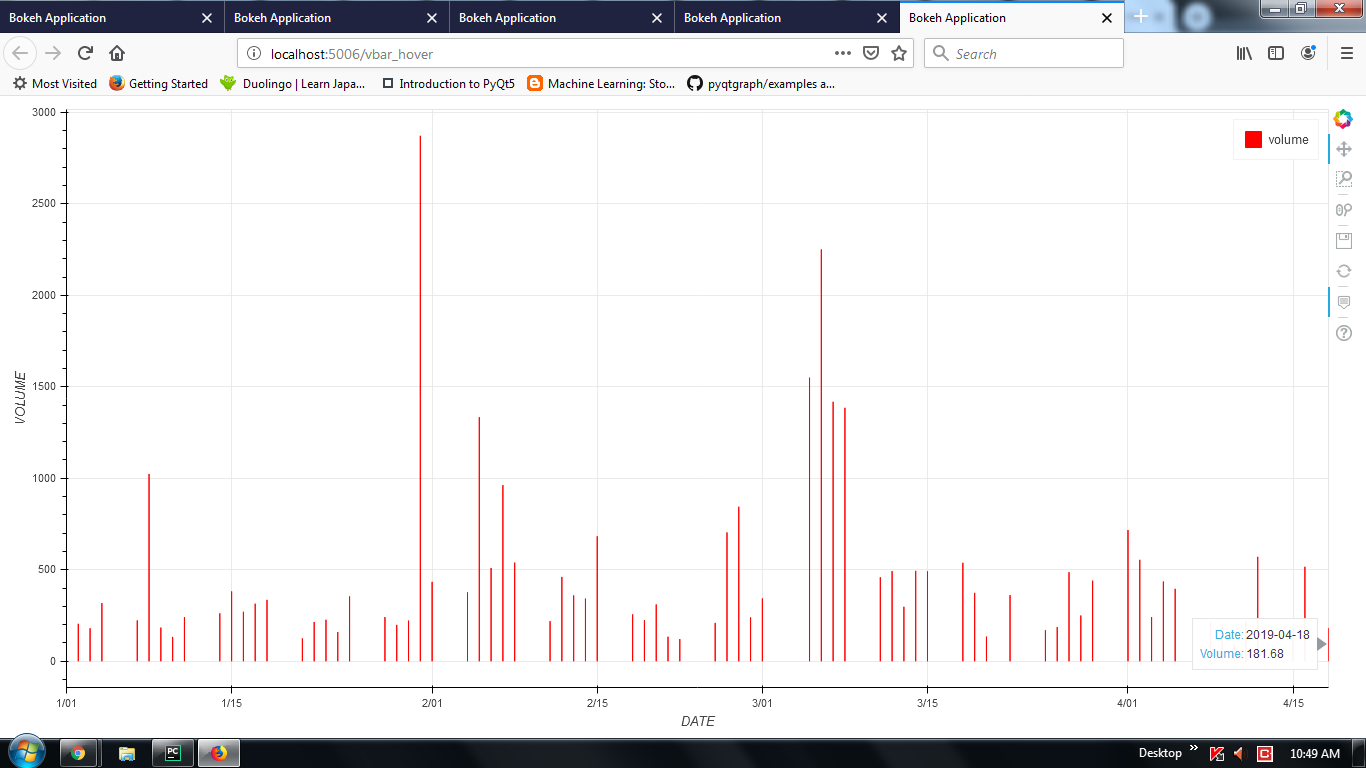
Thank you @Bryan. After doing changes as you mentioned it works for me. But my real issue is with below graph, while applying “hline” mode of Hovertool it works perfectly, but while applying “vline” mode, it doesn’t work on graph rather it display hover on axis for inital and final value.
@internshipdeco this seems like a separate issue. In order to keep the Disocurse organized and as useful as possible for search, can you post a new topic with a complete script that I can just run out of the box to investigate?