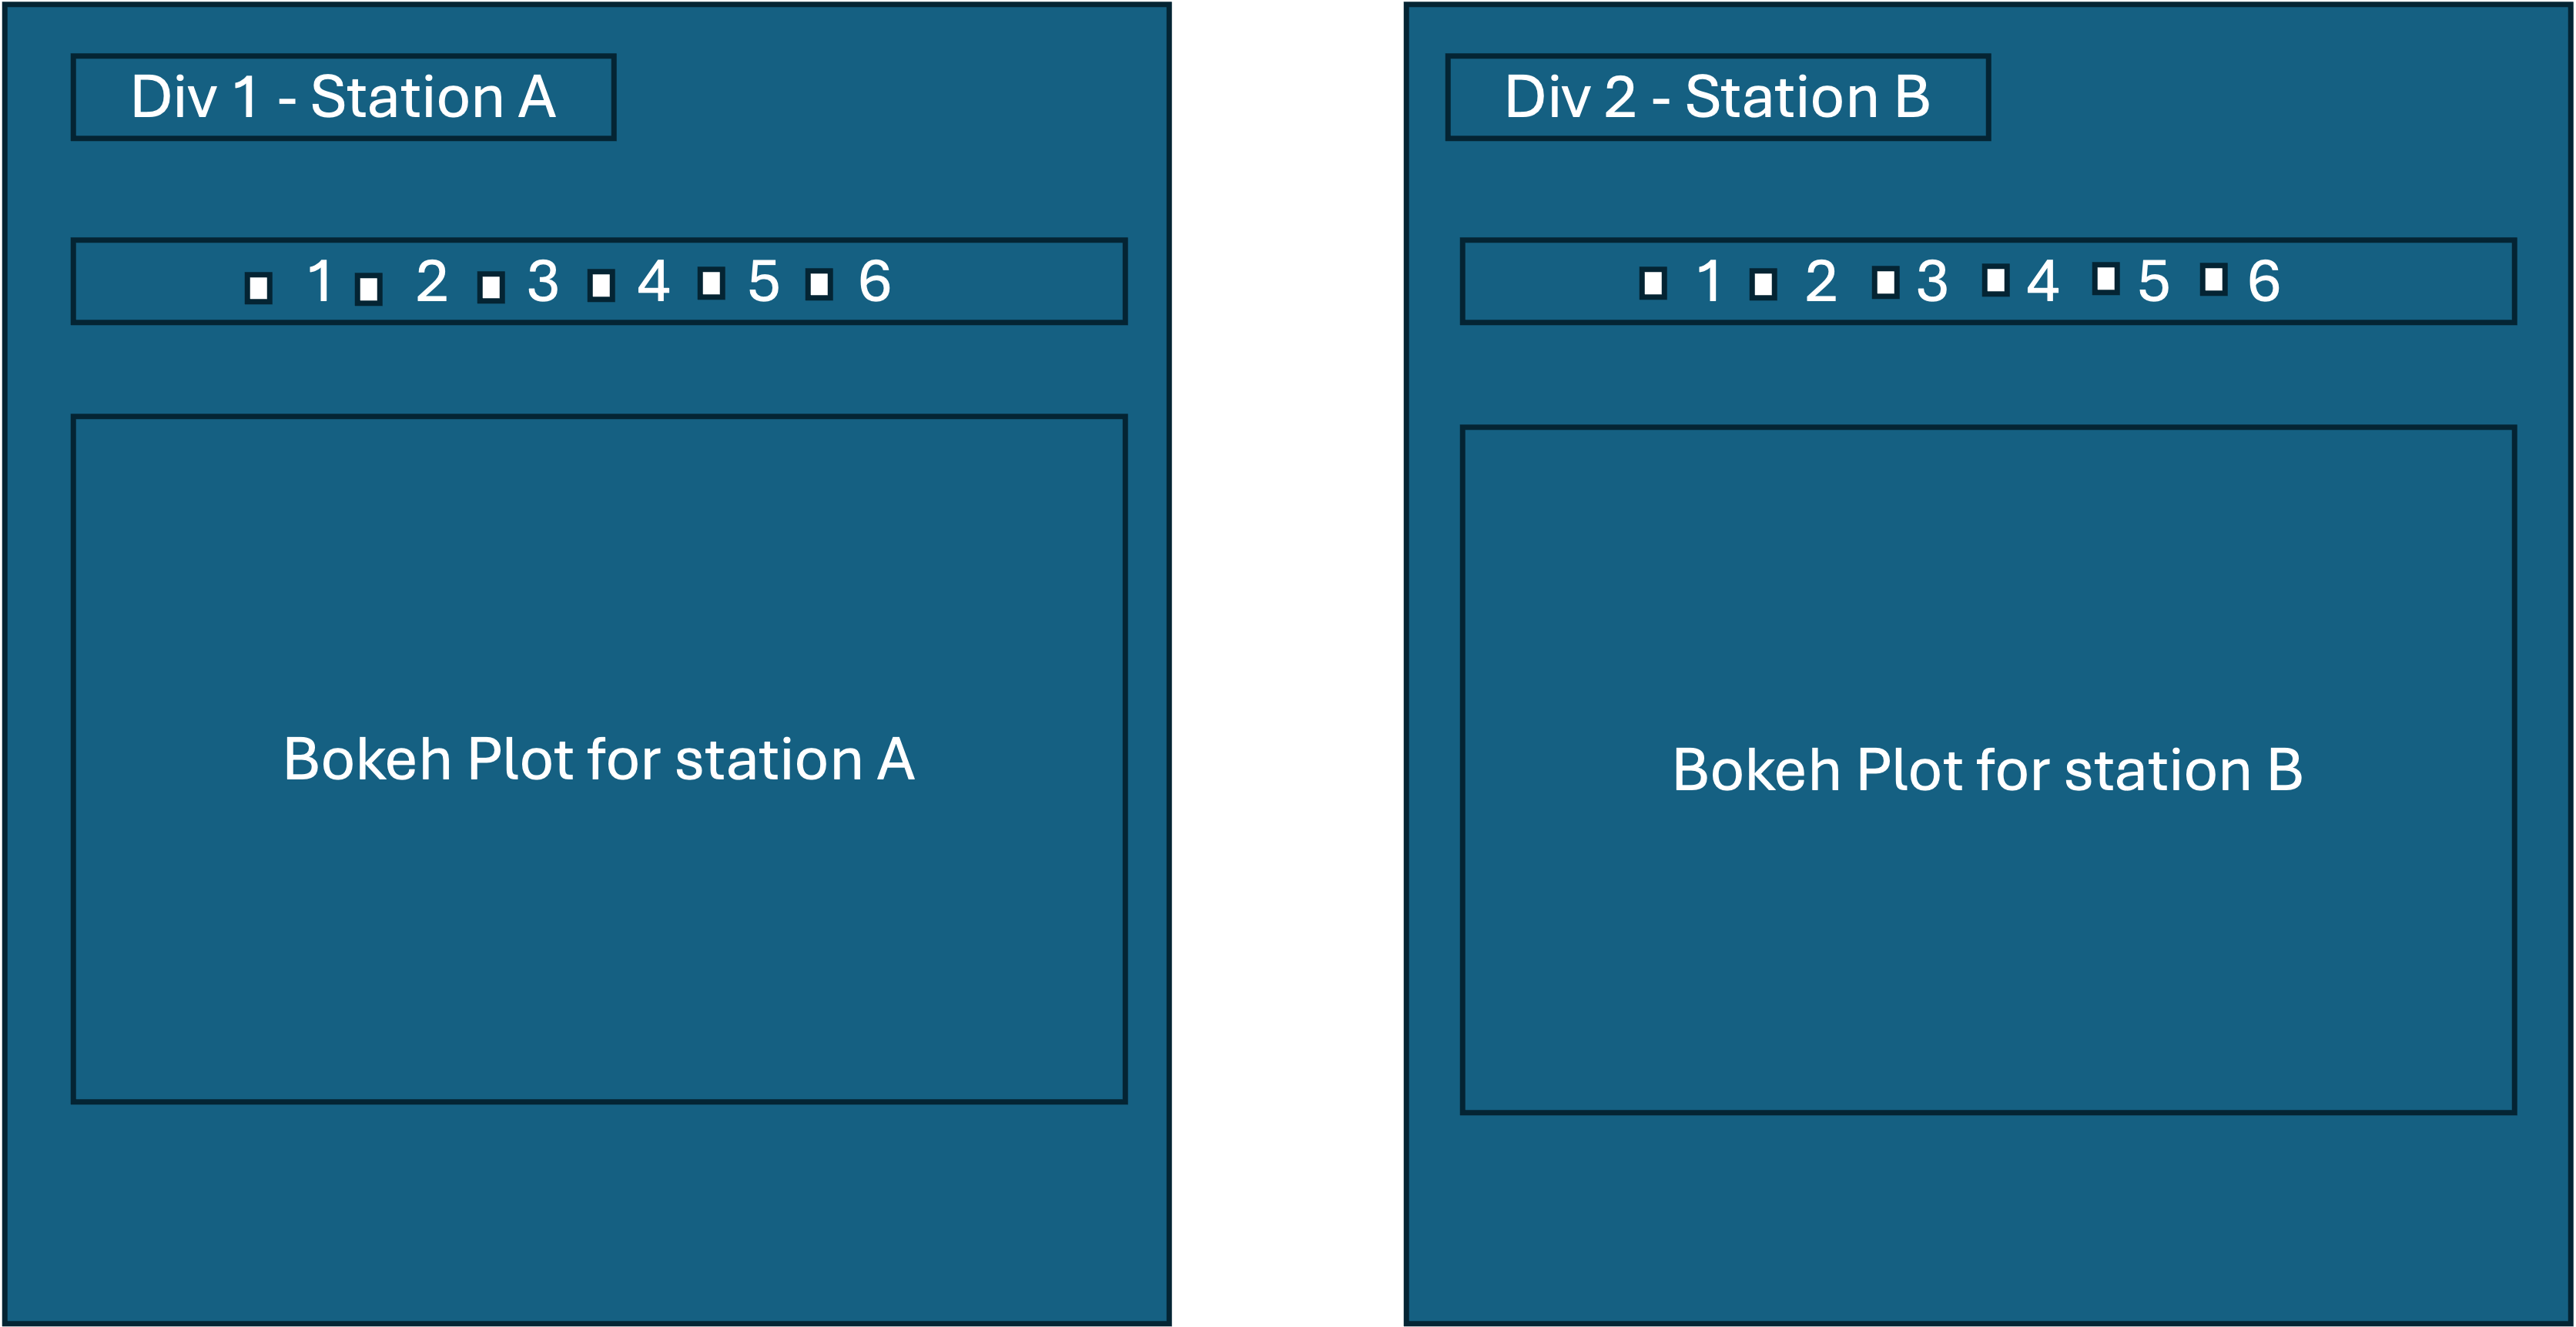
Hello, my apologies for not including an MRE - it was going to take me some time to strip the code down to its representative essentials so I figured I’d ask first without it to see if there was something glaringly wrong with my approach. Below is my attempt at producing the most essential parts for the MRE. When I click the station button a new div is created and the stationVisualization function is called with the station name (stn) and the time of click (nowTime). Hopefully this works.
function createBokehPlot(nowTime,data,stn){

     // set up Bokeh plot


    // Form the required column data source
    var allTimeSeries = [];

    for (iData = 0; iData<data.length; iData++){

        // form the column data source
        allTimeSeries.push(new Bokeh.ColumnDataSource({data:{time:data[iData].time,
                                                            ydata:data[iData].ydata}}));

        } // end of loop through data

     // Plot range
     var xdr = new Bokeh.Range1d({ start: nowTime-86400*1000, end: nowTime });
     var ydr = new Bokeh.Range1d({ start: -5.0, end: 5.0 });

     var plot = Bokeh.Plotting.figure({
         tools: "pan,crosshair,wheel_zoom,box_zoom,reset,save",
         x_axis_type: "datetime",
         x_axis_label: "time",
         y_axis_label: "Y-data",
         x_range: xdr,
         y_range: ydr

         }); // end of bokeh plot definition


     // Plot all the lines but set visibility to off - when a checkbox is clicked, visibility will be toggled

     lineSet = [];
     for (iData = 0; iData < data.length; iData++){
          lineSet.push(plot.line({field:"time"}, {field:"ydata"}, {source: allTimeSeries[iData], name:data[iData].streamName, visible:false}));
          }

     return plot;

 } // end of createBokehPlot function


function stationVisualization(stn,nowTime){
    var stnPlotDiv = d3.selectAll('div#stationDataVisualization').append('div')
        .attr('class','stationPlot p-4 mb-4')
        .attr('id',stn);


     // Load the json file according to the station that was clicked
    d3.json('json/'+stn+'.json?v=' + Date.now()).then(function (stnData){

        //Outer div for all checkboxes
        var outsideCheckBoxDiv = stnPlotDiv.append('div')
                                            .attr('class','checkBoxGroupDiv');


        // div containing the plot
        var plotDiv = stnPlotDiv.append('div')
                                   .attr('class','plotDiv')
                                   .attr('id','plotDiv'+stn);

        // data streams inside the station json file - 1 to 6 in this example
        var allStreamNames = stnData.map(function(d){return d.streamName});

        // create Bokeh plot
        var plot = createBokehPlot(nowTime,stnData,stn);


        // set up checkboxes
        allStreamNames.forEach(function(d,i){
            var checkboxLabel =  d;
            var checkboxAndLabelDiv = outsideCheckBoxDiv.append('div')
                                                        .attr('class','checkboxAndSatLabelDiv');

            // Append checkbox to the div around the checkbox and label
            checkboxAndLabelDiv.append('div')
                               .attr('class','checkboxDiv')
                               .append('input')
                               .attr('type','checkbox')
                               .attr('class',' me-2')
                               .attr('label',checkboxLabel)
                               .on('click',function(event){
                                 // check if the box is checked
                                 var isChecked = d3.select(this).node().checked;

                                 plotSet = plot.select(name=d);

                                 plotSet.forEach(function(plots){
                                      if (isChecked) plots.visible = true;
                                      else plots.visible = false;
                                   }); //end of plotset loop

                               }); // end of checkbox click behavior


            // append checkbox labels
            checkboxAndLabelDiv.append('div')
                               .attr('class','checkboxSatLabelDiv')
                               .append("text")
                               .text(d)
                               .attr('id','checkbox-'+d)
                               .html("<label for=" +checkboxLabel +">" + d + "</label>");

        }); // end of loop through allStreams


        // Show the plot in the correct div
        Bokeh.Plotting.show(plot,'#plotDiv'+stn);

    }); //end of json load

} // end of stationVisualization