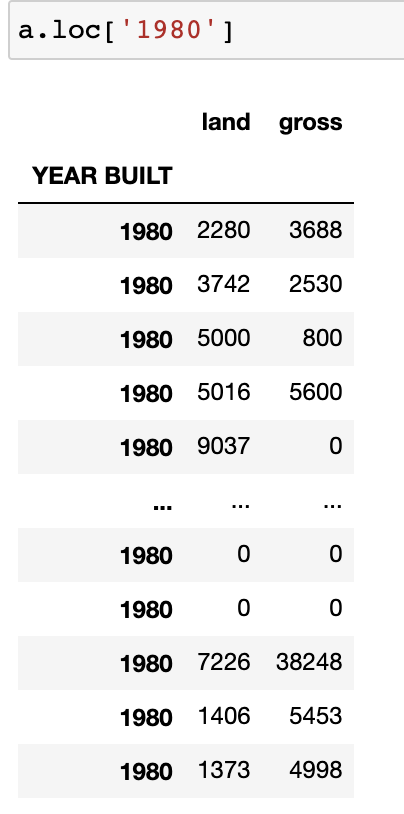
Dateframe as above and I want to make an interactive graph with scatterplot and slider with year. The scatterplot wasn’t updated with the slicer. Could anyone help me with this? Thanks.
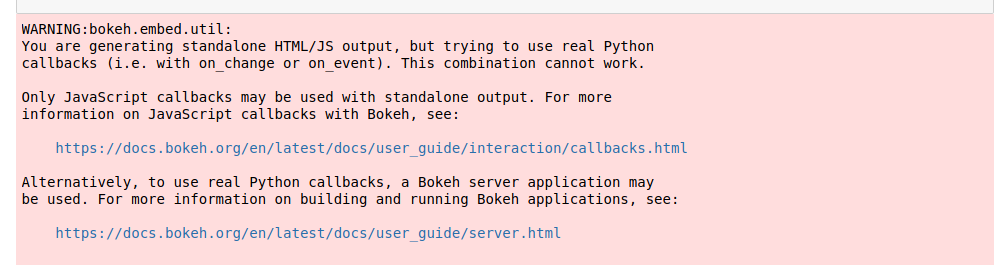
If you’re working in a notebook, you’ll want a Javascript callback rather than a Python one. In fact, the notebook should have let you know with a big red error:
Try rewriting your callback in JS and let us know if you need assistance. Also, let us know if the error didn’t show for you-- that’d be good information for us to have!
And, if you do require real Python callbacks, you can embed a Bokeh server application in a notebook, but that has a particular structure to follow. See this example: