

☰Read-only archive⌕
Looking for help with Bokeh?

This is a read-only archive. Ask questions and join the conversation on GitHub.

Visit Community Support on GitHub →
Archived discussions · Captured October 28, 2026

Slicer with scatter plot isn't updated

Community Support
Ray
Ray


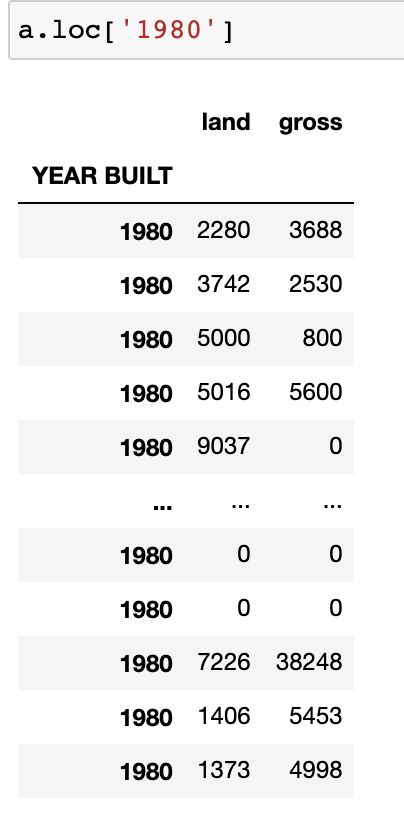
Dateframe as above and I want to make an interactive graph with scatterplot and slider with year. The scatterplot wasn’t updated with the slicer. Could anyone help me with this? Thanks.


slider = Slider(title='my slider', start=1900, end=2019, step=1, value=1900)
source = ColumnDataSource({'x': a['land'], 'y': a['gross']})
p.circle('x', 'y', source=source)
def update_plot(attr, old, new):
    yr = slider.value
    new_data = {
        'x': a.loc[yr].land,
        'y': a.loc[yr].gross,
    }
    source.data = new_data

slider.on_change('value', update_plot)
layout = column(column(slider),p)
show(layout)


⌁   Link to post
carolyn
carolyn

@Ray,

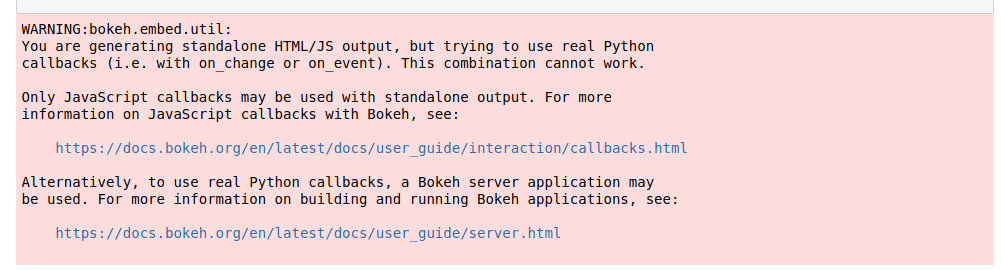
If you’re working in a notebook, you’ll want a Javascript callback rather than a Python one. In fact, the notebook should have let you know with a big red error:

Try rewriting your callback in JS and let us know if you need assistance. Also, let us know if the error didn’t show for you-- that’d be good information for us to have!

⌁   Link to post

End of archived discussion · Replies are disabled
