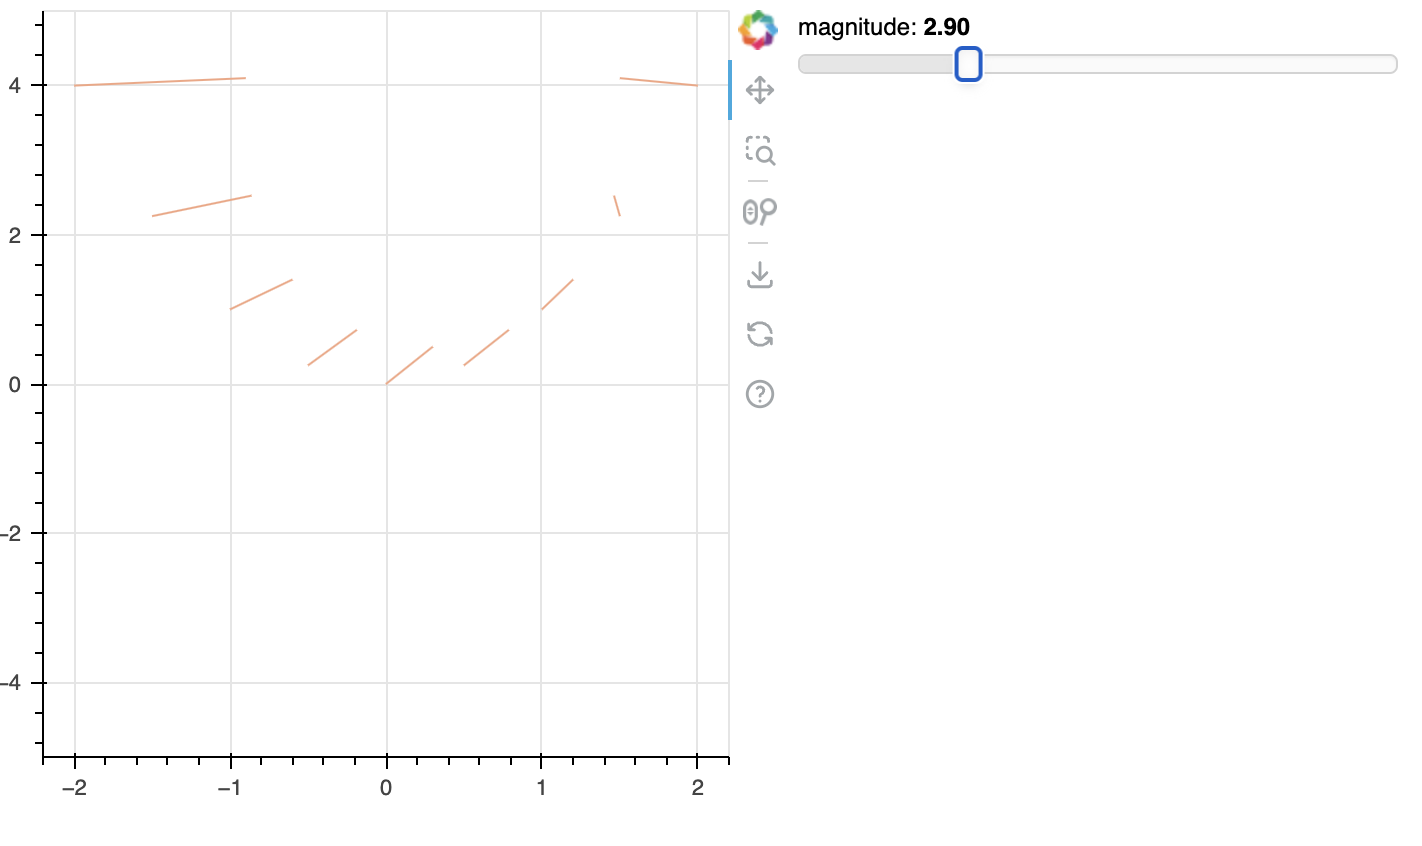
Inspired by the demo: slider — Bokeh 3.5.1 Documentation
I’m trying to do something similar with line segments (eventually arrows). Specifically, I’d like to have a slider that when dragged modifies the calculation of the one of the endpoints of each of the line segments. Essentially allowing them to grow and shrink as I drag the slider around. Again with deep inspiration from slider — Bokeh 3.5.1 Documentation I’ve tried to build this and the plot looks really nice. However, I’m clearly doing something wrong with the call back because the line segments don’t change when I click and drag on the “magnitude slider”. I feel like I’m close but I’m missing some fundamental concept.
Any guidance would be much appreciated!
The complete minimal reproducible example is:
import numpy as np
from bokeh.layouts import column, row
from bokeh.models import ColumnDataSource, CustomJS, Segment, Slider
from bokeh.plotting import figure, show

# Create initial segment data
N = 9
x = np.linspace(-2, 2, N)
y = x**2
source = ColumnDataSource(
    dict(
        x=x,
        y=y,
        xm01=x - x**3 / 10 + 0.3,
        ym01=y - x**2 / 10 + 0.5,
    )
)

# Create figure
plot = figure(y_range=(-5, 5), width=400, height=400)

# Plot initial data
glyph = Segment(
    x0="x", y0="y", x1="xm01", y1="ym01", line_color="#f4a582", line_width=1
)
plot.add_glyph(source, glyph)

# Slider with the intention of scaling the magnitude of segments
mag = Slider(start=0.1, end=10, value=1, step=0.1, title="magnitude")

# Call back to change one end point of segments when slider moves
callback = CustomJS(
    args=dict(source=source, mag=mag),
    code="""
    const m = mag.value

    const x = source.data.x
    const y = source.data.y

    const xm01 = x - m * (x**3 / 10 + 0.3),
    const ym01 = y - m * (x**2 / 10 + 0.5),

    source.data = { x, y, xm01, ym01 }
""",
)  # noqa

# Make call back active
mag.js_on_change("value", callback)

# Show the figure
show(row(plot, column(mag)))
Screenshot for reference: