

Hi, I have followed this tutorial: Making Interactive Visualizations with Python Using Bokeh – Capsicum.
I have copied the full code from there, and the only change i have done is to swap the gapminder data with my own, and changed the ranges of the axis to match my data.
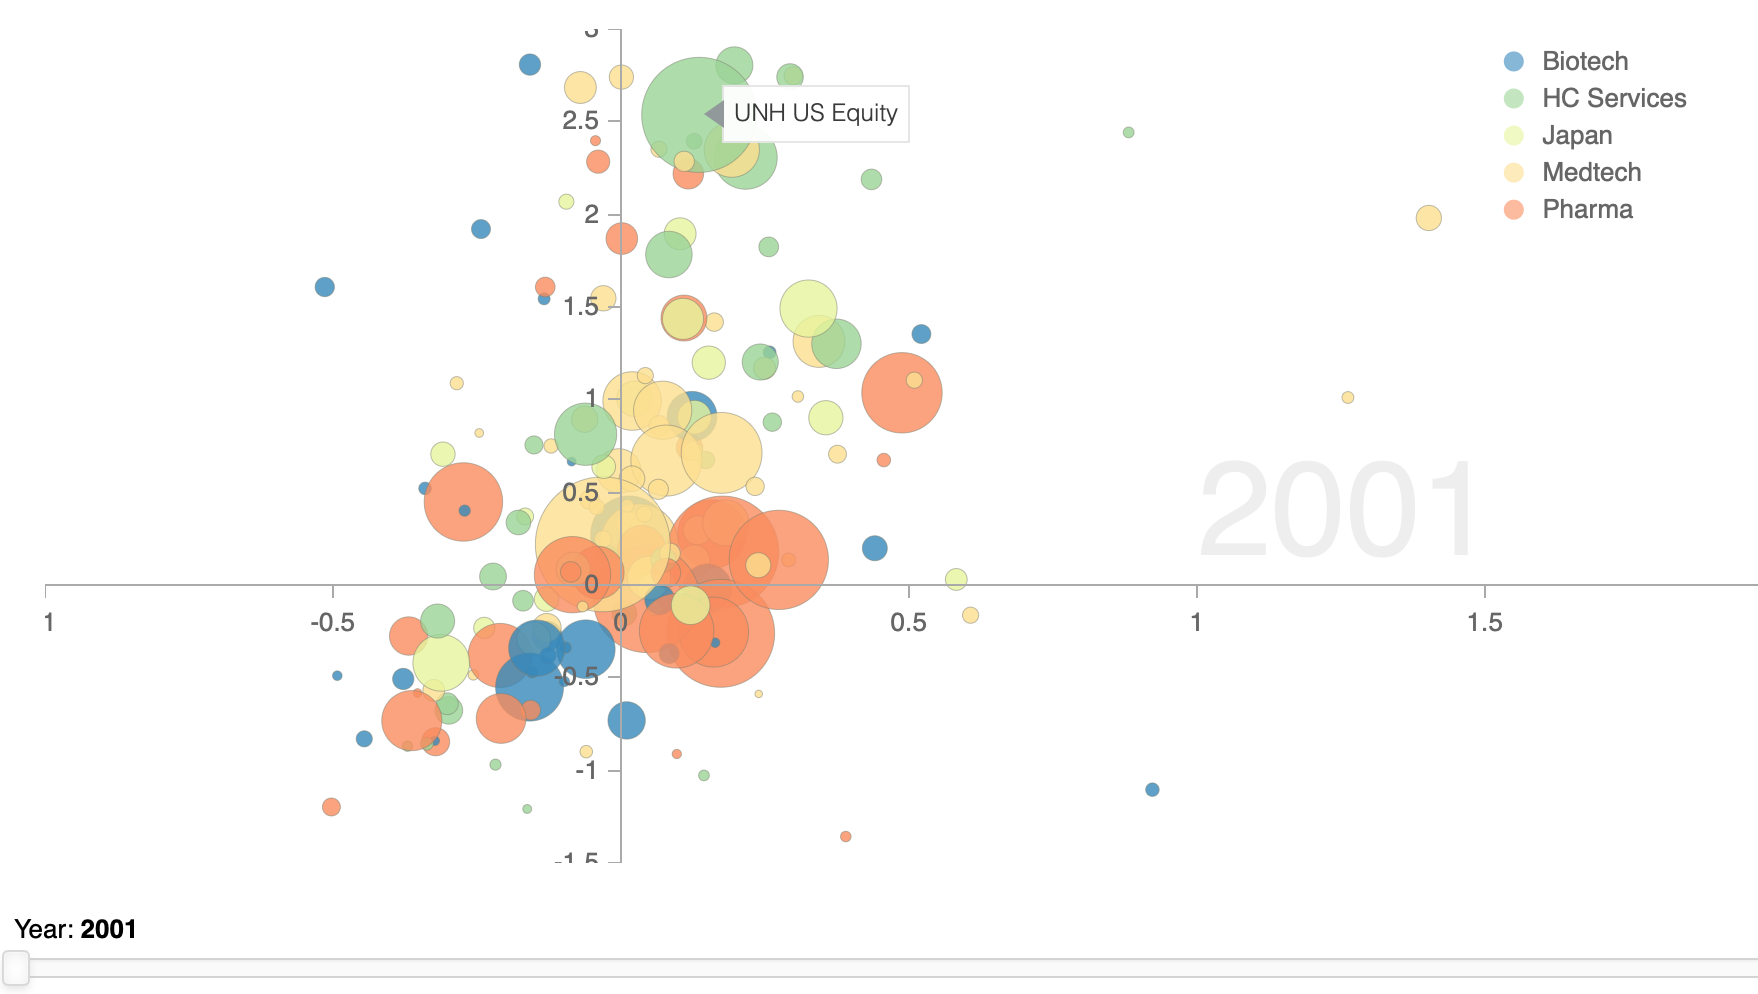
Plot shows fine at the first year, but when sliding slider, it doesn’t update the plot.
I have checked by printing the gapminder data, that my files looks exactly the same.
I’m out of ideas on where to troubleshoot.
Below is my plot.
Extra info: Im using Django and deploying to Google App Engine.
I have this included within the head tag of my html:
link rel href=“http://cdn.pydata.org/bokeh/release/bokeh-1.3.4.min.css” rel=“stylesheet” type=“text/css”>
link rel href=“http://cdn.pydata.org/bokeh/release/bokeh-widgets-1.3.4.min.css” rel=“stylesheet” type=“text/css”>
script src=“http://cdn.pydata.org/bokeh/release/bokeh-1.3.4.min.js”>
script src=“http://cdn.pydata.org/bokeh/release/bokeh-widgets-1.3.4.min.js”>
Anyone with the same issue, or some pointers on anywhere to search for a solution?


