Hi everyone,
I’ve been following the Bokeh tutorials and tried something similar to the “Sliders example”. Both in my own code and executing the example the figure shows up without the sliders. I haven’t been able to find anything in google about this issue. What could be happening for the sliders to not show without any error message?
My code is the following:
output_file('testUMAPslider.html')
#Load the datframe
df = pd.read_pickle('testRpDF.pkl')
freq = np.load('testSynth_freq.npy')
#Define the function to select scatter data for each n_neighbors value
def make_dataset(df, n=10):
#Extract the subset of the points with n_neighbors = n
subset = df[df['n_neighbors'] == n]
return ColumnDataSource(subset)
def make_plot(src, colorLabel):
col = ["#%02x%02x%02x" % (int(r), int(g), int(b)) for r, g, b, _ in 255*cm.coolwarm(colors.Normalize()(colorLabel))]
p = figure(plot_width = 700, plot_height = 700,
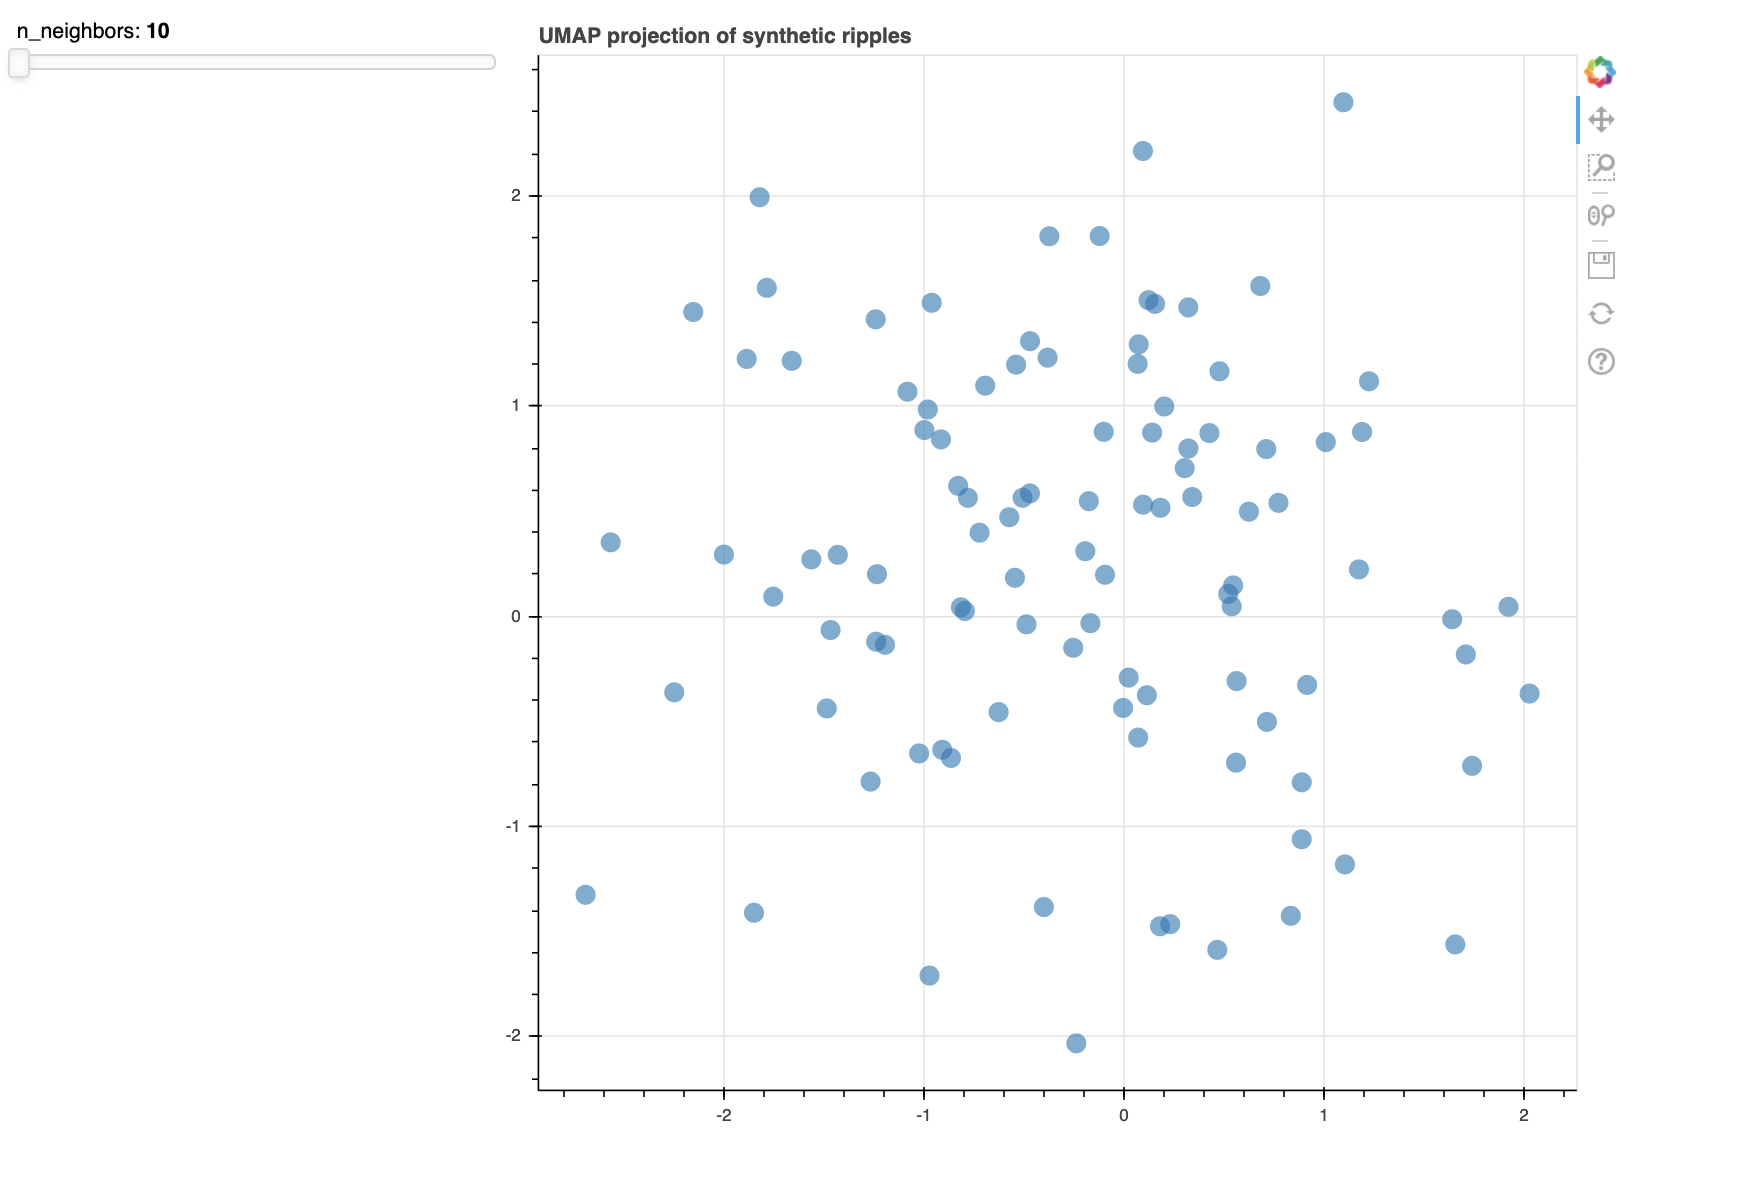
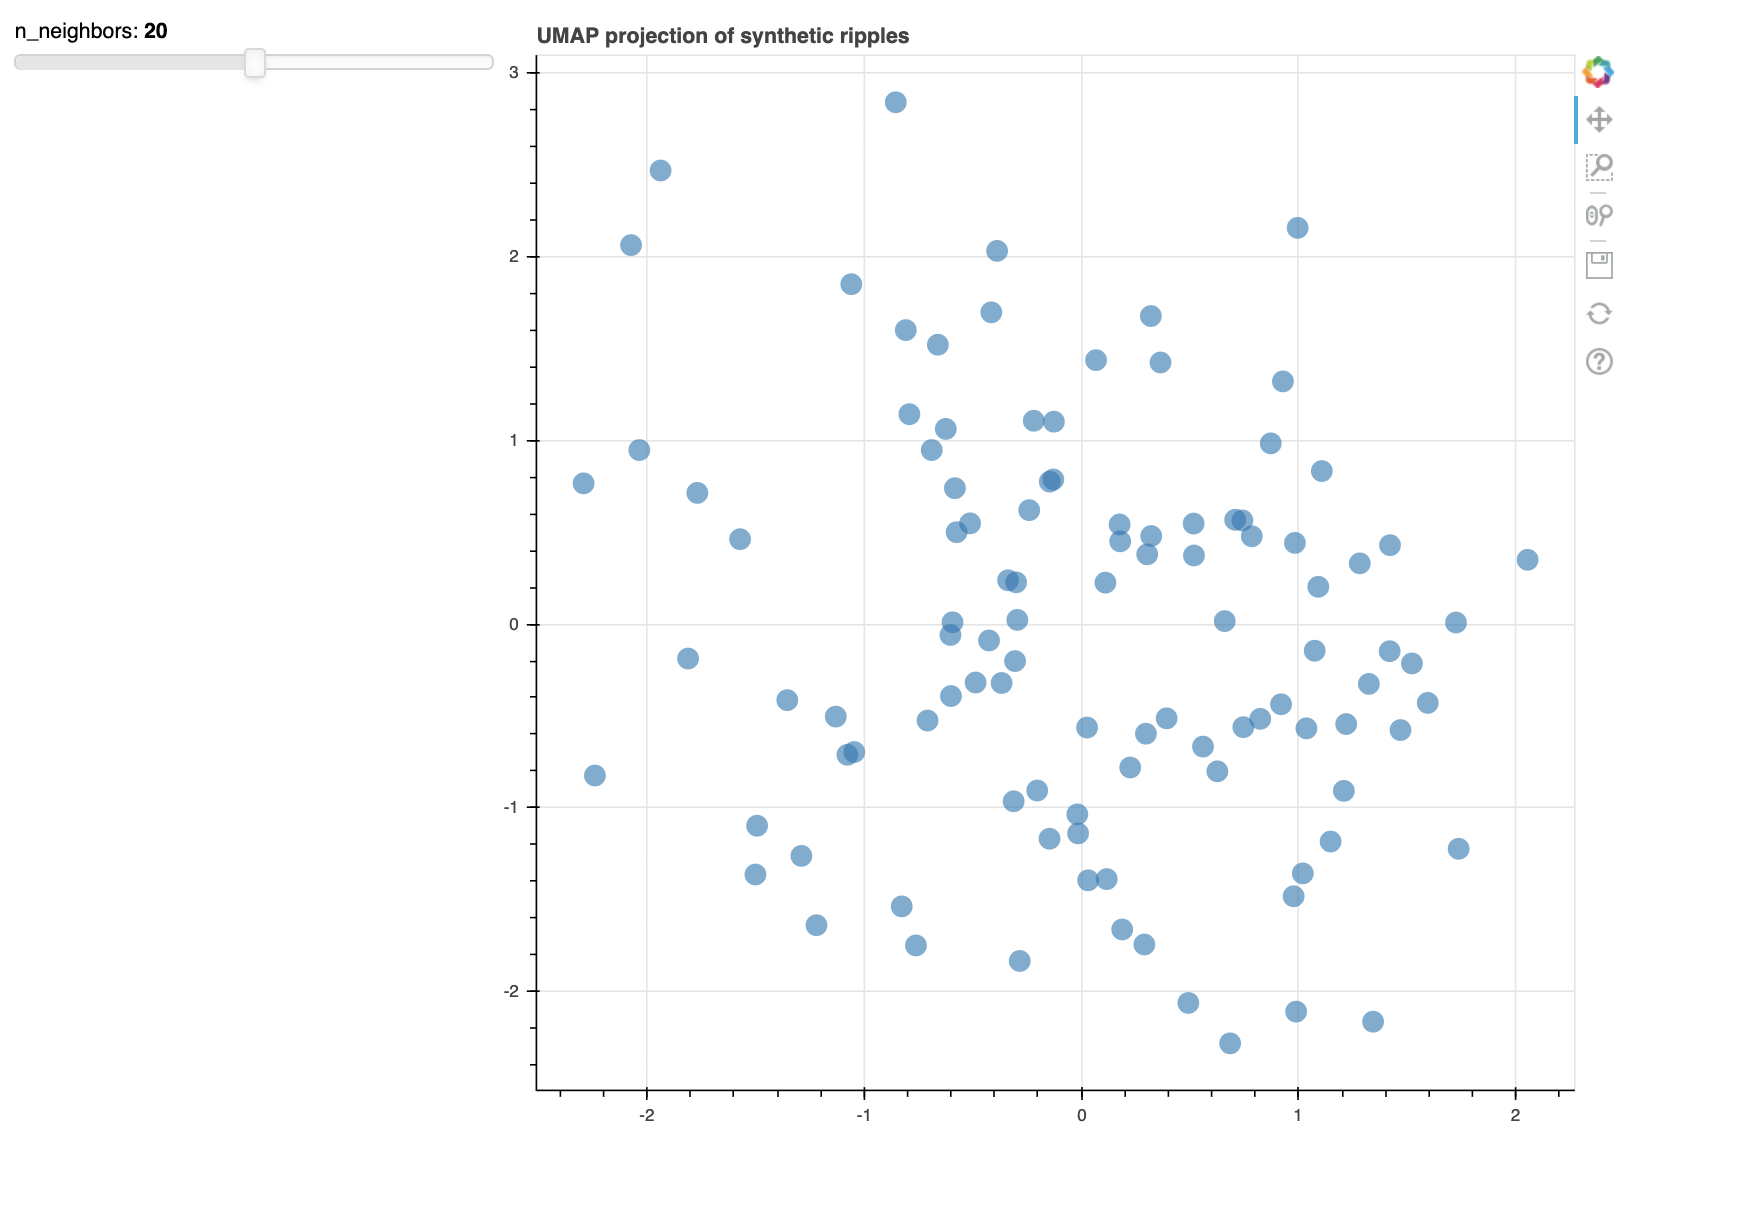
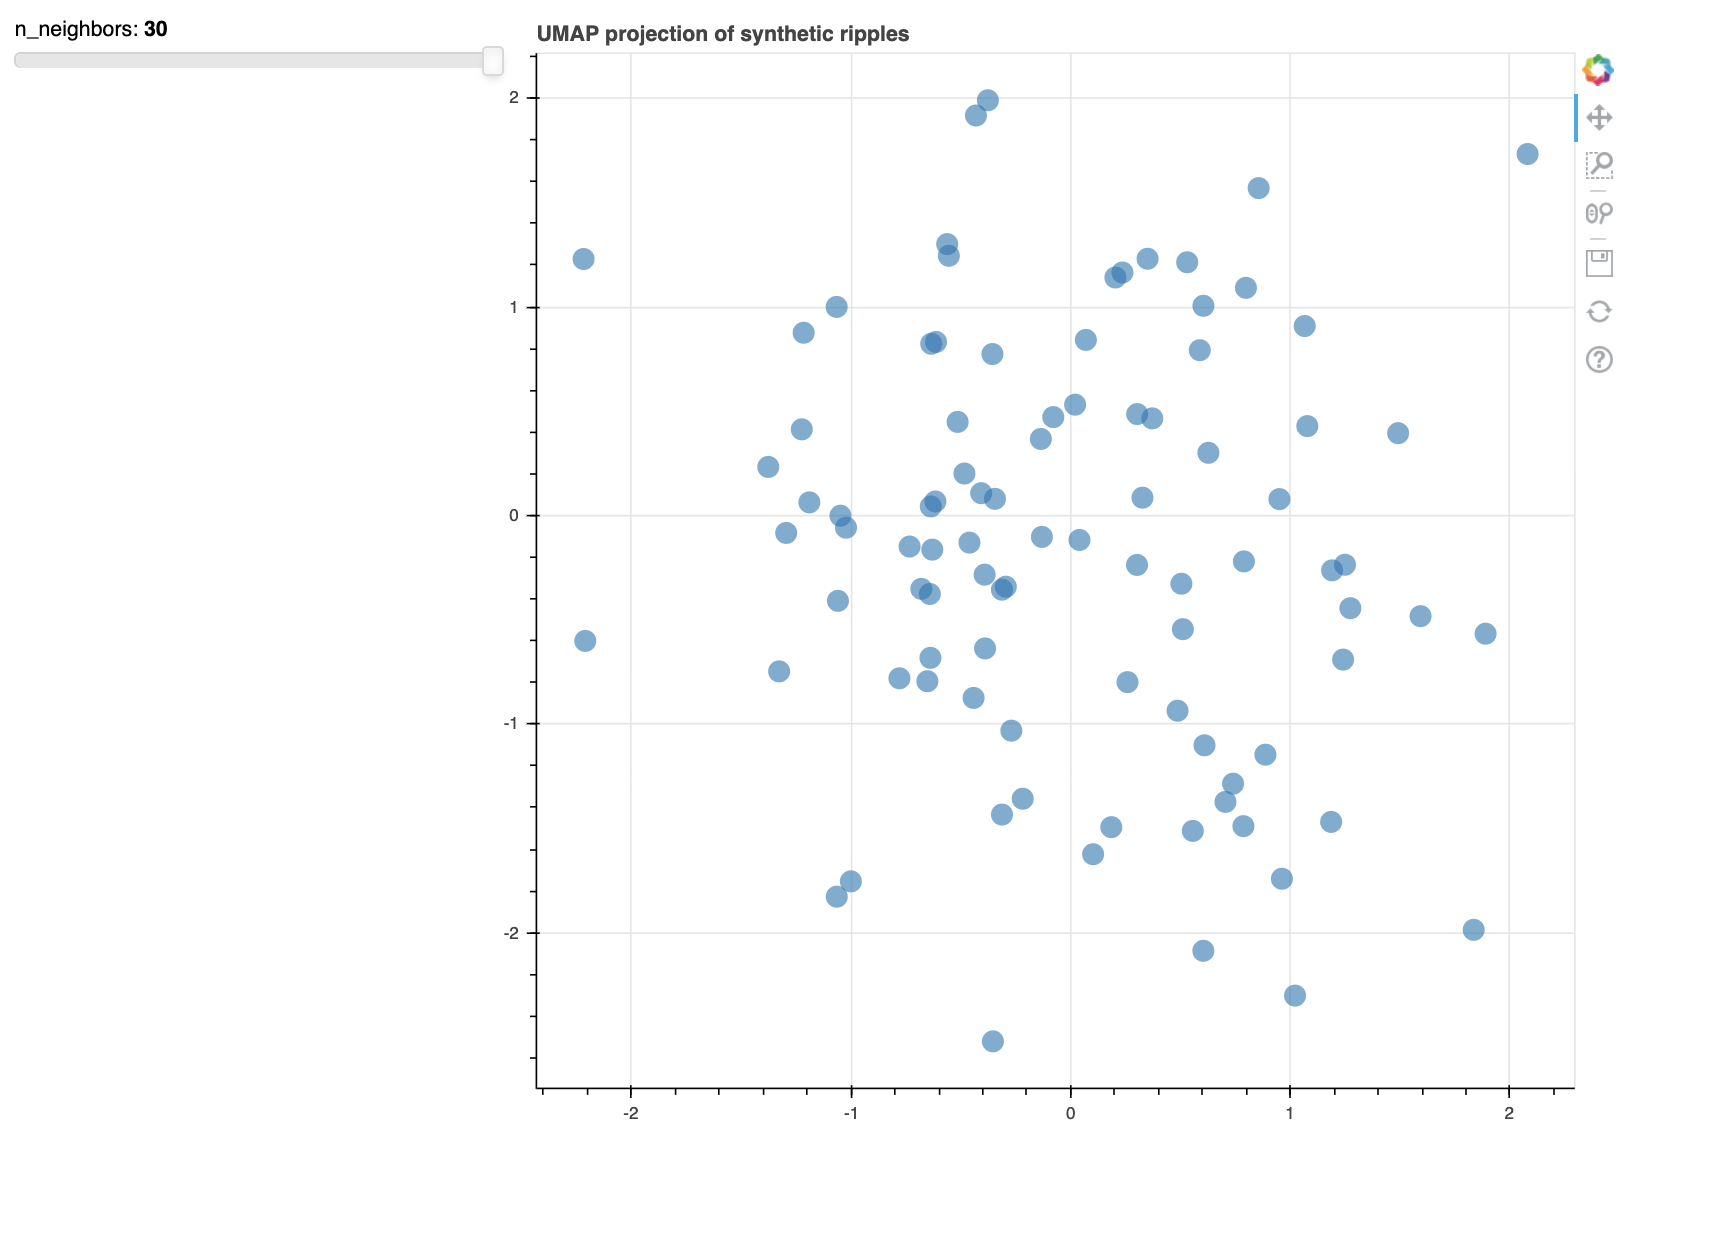
title = 'UMAP projection of synthetic ripples')
p.scatter(src.data['x'], src.data['y'], radius=0.05, fill_color=col, fill_alpha=0.6, line_color=None)
return p
def update(attr, old, new):
new_src = make_dataset(df, neigh_select.value)
src.data = new_src.data
neigh_select = Slider(start = 10, end = 30,
step = 10, value = 10,
title = 'n_neighbors')
neigh_select.on_change('value', update)
# Find the initially selected n_neighbors
initial_neighbors = neigh_select.value
src = make_dataset(df, initial_neighbors)
p = make_plot(src, freq)
# Put controls in a single element
inputs = column(neigh_select)
# Add it to the current document (displays plot)
curdoc().add_root(row(inputs, p, width=500))
curdoc().title = "Sliders"