☰Read-only archive⌕
Looking for help with Bokeh?

This is a read-only archive. Ask questions and join the conversation on GitHub.

Visit Community Support on GitHub →
Archived discussions · Captured October 28, 2026

smooth cruve, static html

Community Support
Shuai_Yang
Shuai_Yang

#!/usr/bin/python
#coding:utf-8
from bokeh.plotting import figure, output_file, show
from bokeh.models import FixedTicker
from numpy import arange

x = arange(0,36,1)
y = [0,0.5,4.8,5,5,5,5,5,5,5,5,5,5,5,5,5,5,5,5,5,5,5,5,5,5,5,5,5,5,5,5,5,5,4.8,0.5,0]
output_file(“fangbo.html”)

p = figure(plot_width=400, plot_height=400)
p.line(x,y)

show(p)

``

Hi,

I’m still new in bokeh.
I’m currently building on a visualization project with some discrete points,
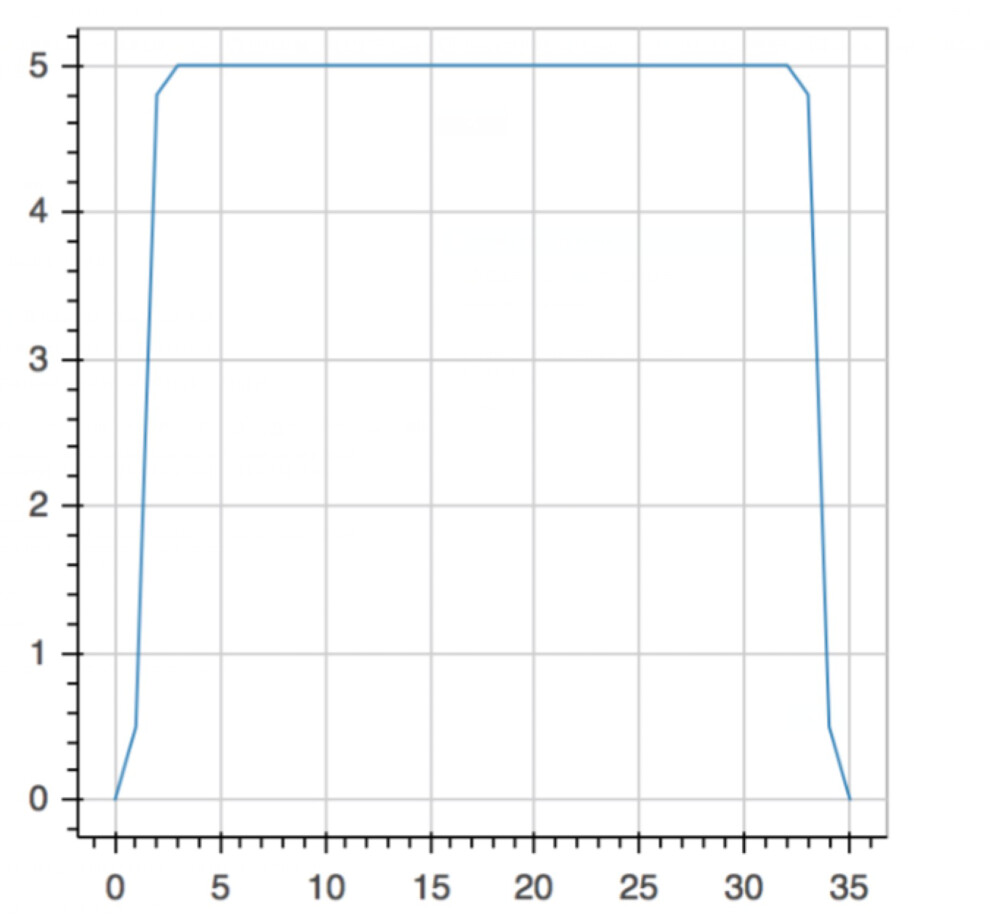
such as x = arang(0,36,1) y = [0,0.5,4.8,5…(28)…5,4.8,0.5,0],I use
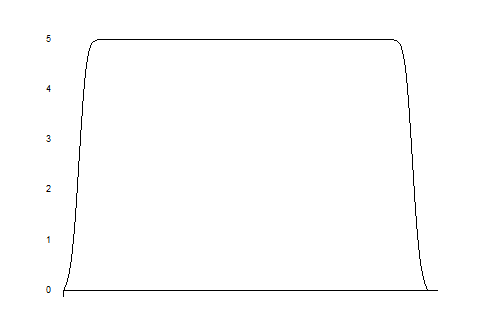
Then run this code I got a line chart, but I want to plot a smooth cruve
How can I fit the cruve to make it smooth. I didn’t find answer in bokeh doc, so I hope solve this problem in here.

Thanks a lot :slight_smile:

Shuai Yang

⌁   Link to post
Peter_Wang1
Peter_Wang1

The only thing you can do to make it more smooth is to increase the number of points. You are currently using 36 points, but for the smoothness that you want, you’ll need 1 point per pixel. So, if your chart is 500 pixels wide, you’ll need x = linspace(0, 35, 500). (Of course, this assumes that the numerical domain of your function is [0,35].)

I’m not sure how you generated your Y values, but you’d need to regenerate them, or define a Python function which can actively and dynamically generate the values as you zoom.

-Peter

···

On Fri, Jun 17, 2016 at 4:44 AM, Shuai Yang yang.young.shuai@gmail.com wrote:

#!/usr/bin/python
#coding:utf-8
from bokeh.plotting import figure, output_file, show
from bokeh.models import FixedTicker
from numpy import arange

x = arange(0,36,1)
y = [0,0.5,4.8,5,5,5,5,5,5,5,5,5,5,5,5,5,5,5,5,5,5,5,5,5,5,5,5,5,5,5,5,5,5,4.8,0.5,0]
output_file(“fangbo.html”)

p = figure(plot_width=400, plot_height=400)
p.line(x,y)

show(p)

``

Hi,

I’m still new in bokeh.
I’m currently building on a visualization project with some discrete points,
such as x = arang(0,36,1) y = [0,0.5,4.8,5…(28)…5,4.8,0.5,0],I use
Then run this code I got a line chart, but I want to plot a smooth cruve
How can I fit the cruve to make it smooth. I didn’t find answer in bokeh doc, so I hope solve this problem in here.

Thanks a lot :slight_smile:

Shuai Yang

–

You received this message because you are subscribed to the Google Groups “Bokeh Discussion - Public” group.

To unsubscribe from this group and stop receiving emails from it, send an email to bokeh+unsubscribe@continuum.io.

To post to this group, send email to bokeh@continuum.io.

To view this discussion on the web visit https://groups.google.com/a/continuum.io/d/msgid/bokeh/58b4d759-309b-4e9c-9b03-d09484d65168%40continuum.io.

For more options, visit https://groups.google.com/a/continuum.io/d/optout.

–

Peter Wang

CTO, Co-founder

[External image unavailable in archive]

⌁   Link to post
Shuai_Yang
Shuai_Yang

Thanks a lot for your answer. Now I have already known bokeh don’t have a function like “spcrv” in matlab, I will try to learn about interpolation with Python.

Finally, I am very sorry for not timely feedback, because the Great Firewall in China.

Shuai Yang

在 2016年6月17日星期五 UTC+8下午6:32:15,pwang写道:

···

The only thing you can do to make it more smooth is to increase the number of points. You are currently using 36 points, but for the smoothness that you want, you’ll need 1 point per pixel. So, if your chart is 500 pixels wide, you’ll need x = linspace(0, 35, 500). (Of course, this assumes that the numerical domain of your function is [0,35].)

I’m not sure how you generated your Y values, but you’d need to regenerate them, or define a Python function which can actively and dynamically generate the values as you zoom.

-Peter

On Fri, Jun 17, 2016 at 4:44 AM, Shuai Yang yang.you...@gmail.com wrote:

#!/usr/bin/python
#coding:utf-8
from bokeh.plotting import figure, output_file, show
from bokeh.models import FixedTicker
from numpy import arange

x = arange(0,36,1)
y = [0,0.5,4.8,5,5,5,5,5,5,5,5,5,5,5,5,5,5,5,5,5,5,5,5,5,5,5,5,5,5,5,5,5,5,4.8,0.5,0]
output_file(“fangbo.html”)

p = figure(plot_width=400, plot_height=400)
p.line(x,y)

show(p)

``

Hi,

I’m still new in bokeh.
I’m currently building on a visualization project with some discrete points,
such as x = arang(0,36,1) y = [0,0.5,4.8,5…(28)…5,4.8,0.5,0],I use
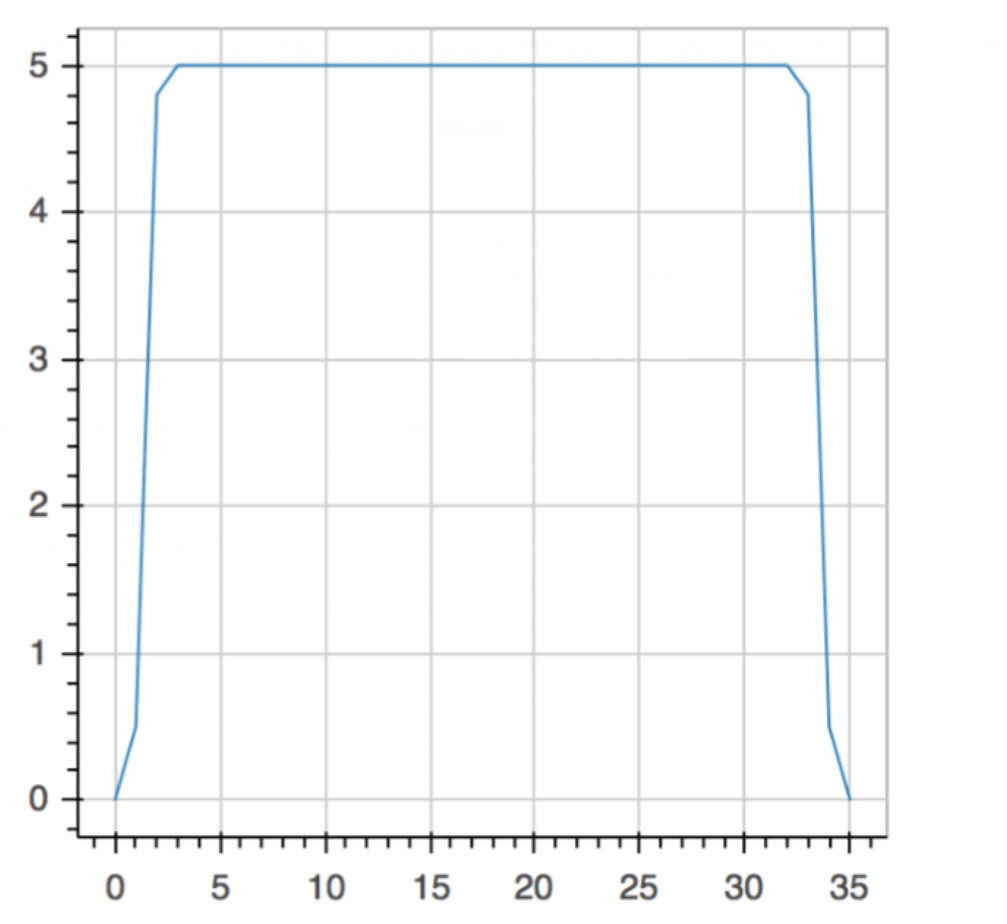
Then run this code I got a line chart

, but I want to plot a smooth cruve
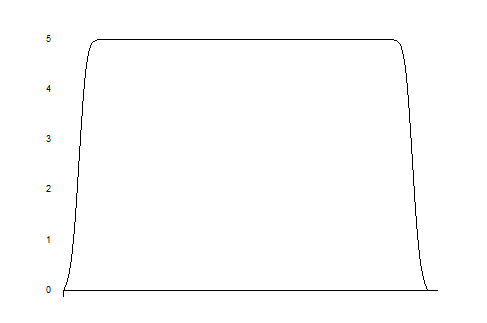
How can I fit the cruve to make it smooth. I didn’t find answer in bokeh doc, so I hope solve this problem in here.

Thanks a lot :slight_smile:

Shuai Yang

–

You received this message because you are subscribed to the Google Groups “Bokeh Discussion - Public” group.

To unsubscribe from this group and stop receiving emails from it, send an email to bokeh+un...@continuum.io.

To post to this group, send email to bo...@continuum.io.

To view this discussion on the web visit https://groups.google.com/a/continuum.io/d/msgid/bokeh/58b4d759-309b-4e9c-9b03-d09484d65168%40continuum.io.

For more options, visit https://groups.google.com/a/continuum.io/d/optout.

–
Peter Wang

CTO, Co-founder

⌁   Link to post

End of archived discussion · Replies are disabled