☰Read-only archive⌕
Looking for help with Bokeh?

This is a read-only archive. Ask questions and join the conversation on GitHub.

Visit Community Support on GitHub →
Archived discussions · Captured October 28, 2026

Source data usage

Community Support
grzegorz.malinowski
grzegorz.malinowski

I’m wondering what would be the correct way to assign data that is divided/multiplied by constant or summed up or averaged (examples: np.sum(data) , np.cumsum(data/np.sum(data)) to y not using ColumnDataSource. Apperciate any suggestion.

data = np.array([3, 2, 5, 6, 2])

s_data = {'category': category,
          'y_data': data,
          'proportion': data/np.sum(data),
          'cum_proportion': np.cumsum(data/np.sum(data))}

source = ColumnDataSource(data=s_data)

plot_S.line(x='category', y='proportion', source=source)
plot_S.line(x='category', y='cum_proportion', source=source)

⌁   Link to post
grzegorz.malinowski
grzegorz.malinowski

This is mainly because data is already defined in CDS: ‘y_data’: data
So the rest is just simply math operations utilizing this variable. I was thinking about sth like this:

plot_S.line(x=‘category’, y=‘y_data’.cumsum(), source=source)

⌁   Link to post
p-himik
p-himik

The link is right there in my previous message. If you want additional functions to be built into Bokeh, please create a feature request on GitHub.

The documentation website has a search capability. If you follow the link above, the search field will be in the top left corner.

⌁   Link to post
_jm
_jm

@grzegorz.malinowski

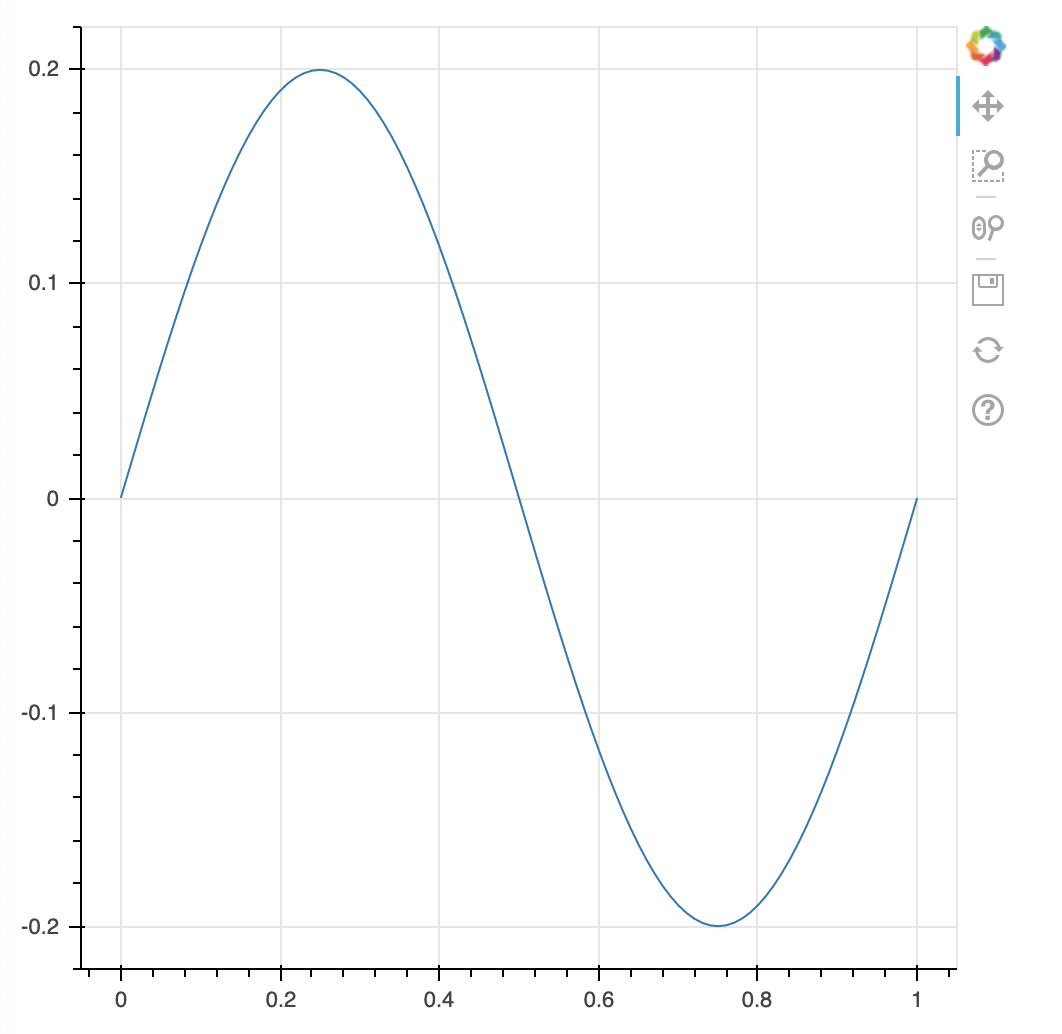
Here’s a basic example where the y data are a sine wave, and the plotted signal is this signal with 1/5 amplitude by using the CustomJSTransform.

The vectorized function argument v_func means that the transform is applied to a vector of values (in this case a sampled sine-wave) and returns a signal of equal length transformed through that function v_func.

#!/usr/bin/env python3
# -*- coding: utf-8 -*-
"""
"""
import numpy as np

from bokeh.plotting import figure, show

from bokeh.transform import transform
from bokeh.models.transforms import CustomJSTransform

v_func = '''
    var rv = new Float64Array(xs.length)
    for(let i = 0; i < xs.length; i++) {
        rv[i] = xs[i] / 5.0
    }
    return rv
'''

x = np.linspace(0.0,1.0,101)
y = np.sin(2.0*np.pi*x)

data = dict(x=x, y=y)

p = figure(width=500, height=500)
ry = p.line(x='x',y=transform('y', CustomJSTransform(v_func=v_func)), source=ColumnDataSource(data=data))

show(p)

⌁   Link to post
grzegorz.malinowski
grzegorz.malinowski

Going further. Can anyone look at my CustomJSTransform code for the mean and advise how to initiate Span having empty CDS?

from bokeh.io import curdoc
from bokeh.models import ColumnDataSource
from bokeh.models import Span
from bokeh.plotting import figure
from bokeh.transform import transform
from bokeh.models.transforms import CustomJSTransform

#--> mean
average_jst = '''
var total = 0;
for(var i = 0; i < CDS_lambda.data['y_data'].length; i++) {
    total += CDS_lambda.data['y_data'][i];
}
var avg = total / CDS_lambda.data['y_data'].length;
return avg;
'''

data_lambda = {'category': [],
               'y_data': []}
CDS_lambda = ColumnDataSource(data=data_lambda)

plot_1 = figure()
plot_1.add_layout(Span(location=transform('y_data', CustomJSTransform(v_func=average_jst)), source=CDS_lambda), dimension='width')
⌁   Link to post

End of archived discussion · Replies are disabled