☰Read-only archive⌕
Looking for help with Bokeh?

This is a read-only archive. Ask questions and join the conversation on GitHub.

Visit Community Support on GitHub →
Archived discussions · Captured October 28, 2026

Span on datetime x-axis is not displayed where expected

Community Supportbokeh
cklemy
cklemy

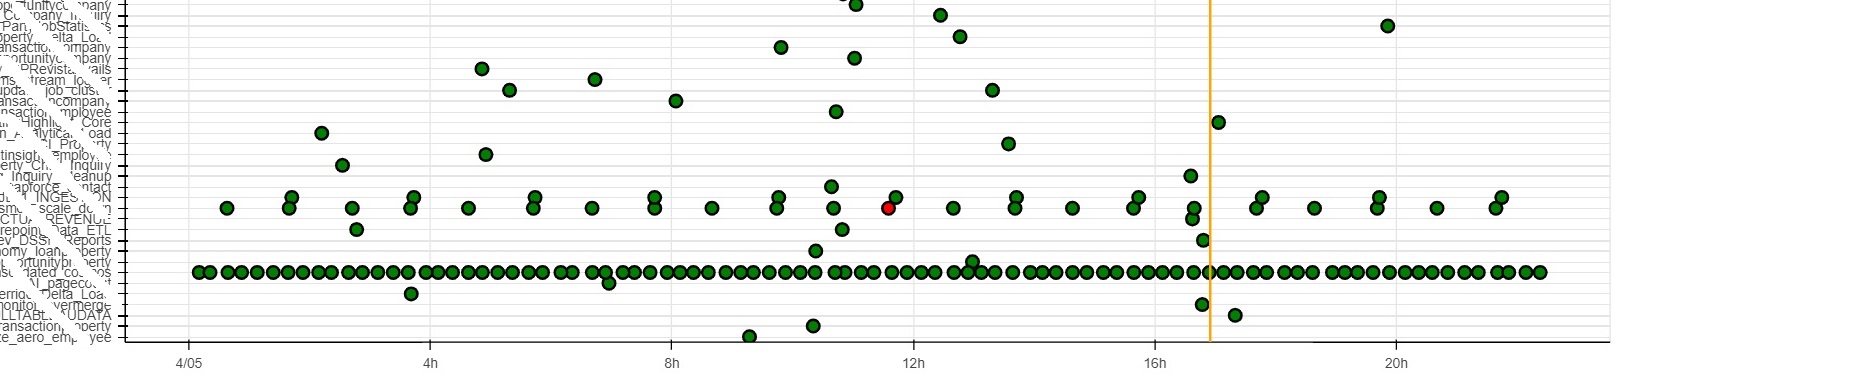
I am new to Python and Bokeh. I have a pandas dataframe which contains Events. I am using Bokeh charts to Visualize events. EventTime is displayed on the x-axis and EventName is projected on the y-axis. The visualization is rendered as expected. I am then trying to add a Span(annotation) on the x-axis(with height dimension) to show when the last event occurred(Max of EventTime). The Span is not displayed where it is expected. Please advise.

Thank you for trying :slight_smile:

Code Snippet:

source = ColumnDataSource(data=dict(
    x = events_to_analyse.EventTime,
    y = events_to_analyse.EventName
))

span_last_udapted = time.mktime(datetime(d_last_updated.year, d_last_updated.month, d_last_updated.day, d_last_updated.hour, d_last_updated.minute, 0).timetuple())*1000
v_span_last_udapted = Span(location=span_last_udapted, dimension='height', line_color='orange', line_width=2)

p = figure(x_axis_type='datetime', y_range=list(set(source.data['y'])), plot_width=1500, plot_height=7000)
p.circle('x', 'y', size=10, line_color='w', fill_color='z', line_width=2, source=source)
p.add_layout(v_span_last_udapted)

show(p)

Note: here d_last_updated = max(EventTime)
⌁   Link to post
cklemy
cklemy

Thank you Bryan for your time.

Here is a minimal Reproducible Example:


import pandas as pd
from datetime import datetime
from dateutil.parser import parse    
from bokeh.plotting import figure, show, output_notebook
from bokeh.models import Span, ColumnDataSource
import time

data = [['eventA', '2023-04-06 01:38:40'], ['eventB', '2023-04-06 02:36:55'], ['eventC', '2023-04-06 08:41:20'],
       ['eventa', '2023-04-06 02:38:40'], ['eventb', '2023-04-06 03:36:55'], ['eventc', '2023-04-06 04:41:20']]
  
# Create the pandas DataFrame
df_events = pd.DataFrame(data, columns=['EventName', 'EventTime'])
df_events['EventTime'] = pd.to_datetime(df_events.EventTime)

source = ColumnDataSource(data=dict(
    x = df_events.EventTime,
    y = df_events.EventName
))

p = figure(x_axis_type='datetime', y_range=list(set(source.data['y'])), plot_width=500, plot_height=300)
p.circle('x', 'y', size=10, line_color='black', fill_color='green', line_width=2, source=source)

d_last_updated = df_events.EventTime.max()
span_last_udapted = time\
.mktime(datetime(d_last_updated.year, d_last_updated.month, d_last_updated.day, d_last_updated.hour, d_last_updated.minute, 0)\
        .timetuple())*1000
v_span_last_udapted = Span(location=span_last_udapted, dimension='height', line_color='orange', line_width=2)
p.add_layout(v_span_last_udapted)

show(p)

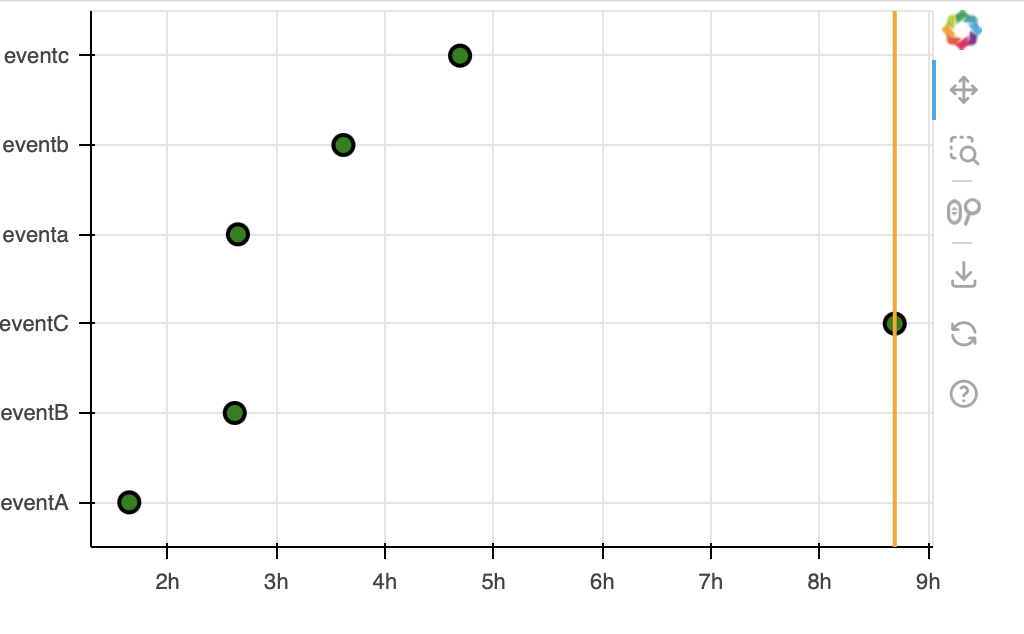
I am expecting the Span to be aligned with ‘eventC’ or ‘2023-04-06 08:41:20’ which is towards the far right end of the figure.

Bokeh Version/Build:
bokeh 2.3.2 py38haa95532_0

⌁   Link to post
Bryan
Bryan

With Bokeh 3.1 and appropriatately updated / simplified code:

p = figure(width=500, height=300,
           x_axis_type='datetime', y_range=source.data['y'].unique())

p.circle('x', 'y', size=10, source=source
         line_color='black', fill_color='green', line_width=2)

v_span_last_udapted = Span(location=df_events.EventTime.max(),
                           dimension='height',
                           line_color='orange',
                           line_width=2)

p.add_layout(v_span_last_udapted)

the expected result is obtained:

So this was fixed at some point since the (fairly old) Bokeh version 2.3.2. It is always advised to check out a suspected bug/problem with the latest version to see if this is the case. The solution is to upgrade your Bokeh version (there will be no more 2.x releases).

⌁   Link to post

End of archived discussion · Replies are disabled