☰Read-only archive⌕
Looking for help with Bokeh?

This is a read-only archive. Ask questions and join the conversation on GitHub.

Visit Community Support on GitHub →
Archived discussions · Captured October 28, 2026

Specify location on categorical axis for BoxAnnotation

Community Support
Till
Till

Hi,

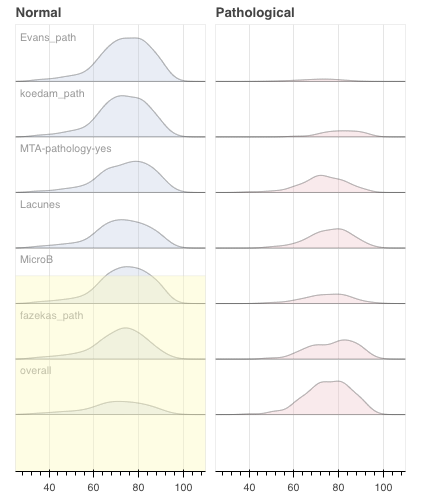
I would like to place a BoxAnnotation on a figure with a categorical axis,

but can’t figure out how to specify the exact location on the axis.

Any help is very much appreciated.

The BoxAnnotation in the picture was placed with help of a numerical axis location.

Screenshot 2018-11-22 at 13.29.42.png

p_normal = figure(y_range=scales, x_range=[25,110], plot_width=w, plot_height=h, toolbar_location=None, title=‘Normal’)

for scoring_variable in scored_variables[1:]:

normal_and_patho_curves = make_ridge(scoring_variable, source_data, x)

p_normal.patch(‘x’, ‘y_normal’, alpha=0.3, line_color=‘black’, source=normal_and_patho_curves, color=‘lightsteelblue’)

ValueError: expected an element of either Auto or NumberSpec(String, Dict(Enum('expr', 'field', 'value', 'transform'), Either(String, Instance(Transform), Instance(Expression), Float)), Float), got ['Lacunes']

p_normal.text(27, y=dodge(‘text’, 0.8, range=p_normal.y_range), text=‘text’, source=ColumnDataSource(data=dict(text=scored_variables[1:])), **text_props)

p_normal.add_layout(BoxAnnotation(top=[‘Lacunes’))

``

Thanks!!

⌁   Link to post
Mateusz_Paprocki2
Mateusz_Paprocki2

Hi,

Hi,

I would like to place a BoxAnnotation on a figure with a categorical axis,

but can’t figure out how to specify the exact location on the axis.

Any help is very much appreciated.

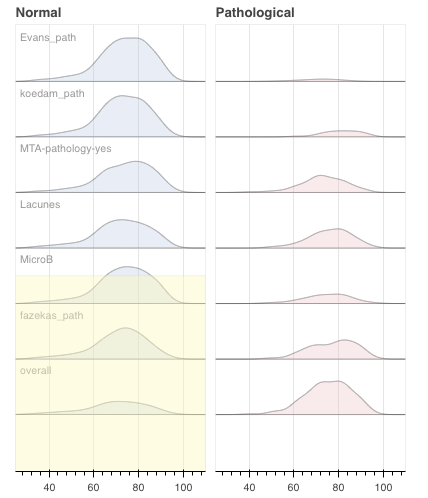
The BoxAnnotation in the picture was placed with help of a numerical axis location.

Screenshot 2018-11-22 at 13.29.42.png

p_normal = figure(y_range=scales, x_range=[25,110], plot_width=w, plot_height=h, toolbar_location=None, title=‘Normal’)

for scoring_variable in scored_variables[1:]:

normal_and_patho_curves = make_ridge(scoring_variable, source_data, x)

p_normal.patch(‘x’, ‘y_normal’, alpha=0.3, line_color=‘black’, source=normal_and_patho_curves, color=‘lightsteelblue’)

p_normal.text(27, y=dodge(‘text’, 0.8, range=p_normal.y_range), text=‘text’, source=ColumnDataSource(data=dict(text=scored_variables[1:])), **text_props)

p_normal.add_layout(BoxAnnotation(top=[‘Lacunes’))

``

BoxAnnotation expects a single coordinate (most annotation aren’t vectorized). It should work when you drop the list.

Mateusz

···

On Thu, Nov 22, 2018 at 1:33 PM landge tschellhorn@gmail.com wrote:

ValueError: expected an element of either Auto or NumberSpec(String, Dict(Enum('expr', 'field', 'value', 'transform'), Either(String, Instance(Transform), Instance(Expression), Float)), Float), got ['Lacunes']

``

Thanks!!

–

You received this message because you are subscribed to the Google Groups “Bokeh Discussion - Public” group.

To unsubscribe from this group and stop receiving emails from it, send an email to bokeh+unsubscribe@continuum.io.

To post to this group, send email to bokeh@continuum.io.

To view this discussion on the web visit https://groups.google.com/a/continuum.io/d/msgid/bokeh/e554fb73-bd4e-43d8-b4bb-4f6a53c83325%40continuum.io.

For more options, visit https://groups.google.com/a/continuum.io/d/optout.

⌁   Link to post
Till
Till

Thanks!

I still get this error:

Javascript Error: Number property 'top' given invalid value: "Lacunes"

When I pass a simple string and not a list.
Do I miss anything?


···

On Thursday, November 22, 2018 at 3:16:31 PM UTC+1, mateusz.paprocki wrote:

Hi,
On Thu, Nov 22, 2018 at 1:33 PM landge tsche...@gmail.com wrote:

Hi,

I would like to place a BoxAnnotation on a figure with a categorical axis,

but can’t figure out how to specify the exact location on the axis.

Any help is very much appreciated.

The BoxAnnotation in the picture was placed with help of a numerical axis location.

Screenshot 2018-11-22 at 13.29.42.png

p_normal = figure(y_range=scales, x_range=[25,110], plot_width=w, plot_height=h, toolbar_location=None, title=‘Normal’)

for scoring_variable in scored_variables[1:]:

normal_and_patho_curves = make_ridge(scoring_variable, source_data, x)

p_normal.patch(‘x’, ‘y_normal’, alpha=0.3, line_color=‘black’, source=normal_and_patho_curves, color=‘lightsteelblue’)

p_normal.text(27, y=dodge(‘text’, 0.8, range=p_normal.y_range), text=‘text’, source=ColumnDataSource(data=dict(text=scored_variables[1:])), **text_props)

p_normal.add_layout(BoxAnnotation(top=[‘Lacunes’))

``

BoxAnnotation expects a single coordinate (most annotation aren’t vectorized). It should work when you drop the list.

Mateusz

ValueError: expected an element of either Auto or NumberSpec(String, Dict(Enum('expr', 'field', 'value', 'transform'), Either(String, Instance(Transform), Instance(Expression), Float)), Float), got ['Lacunes']

``

Thanks!!

–

You received this message because you are subscribed to the Google Groups “Bokeh Discussion - Public” group.

To unsubscribe from this group and stop receiving emails from it, send an email to bokeh+un...@continuum.io.

To post to this group, send email to bo...@continuum.io.

To view this discussion on the web visit https://groups.google.com/a/continuum.io/d/msgid/bokeh/e554fb73-bd4e-43d8-b4bb-4f6a53c83325%40continuum.io.

For more options, visit https://groups.google.com/a/continuum.io/d/optout.

⌁   Link to post
Bryan
Bryan

I believe BoxAnnotation will require work to be able to understand categorical coordinates. A GitHub issue would be reasonable, but please make sure to include a *complete* minimal example script/test case that demonstrates things failing.

Otherwise the default "synthetic" width of each category is "1" so you could use that knowledge to refine the placement using numerical coordinates.

Thanks,

Bryan

···

On Nov 22, 2018, at 09:00, tschellhorn@gmail.com wrote:

Thanks!
I still get this error:

Javascript Error: Number property 'top' given invalid value: "Lacunes"

When I pass a simple string and not a list.
Do I miss anything?

On Thursday, November 22, 2018 at 3:16:31 PM UTC+1, mateusz.paprocki wrote:
Hi,
On Thu, Nov 22, 2018 at 1:33 PM landge <tsche...@gmail.com> wrote:
Hi,

I would like to place a BoxAnnotation on a figure with a categorical axis,
but can't figure out how to specify the exact location on the axis.

Any help is very much appreciated.
The BoxAnnotation in the picture was placed with help of a numerical axis location.

p_normal = figure(y_range=scales, x_range=[25,110], plot_width=w, plot_height=h, toolbar_location=None, title='Normal')

for scoring_variable in scored_variables[1:]:
    normal_and_patho_curves = make_ridge(scoring_variable, source_data, x)
    p_normal.patch('x', 'y_normal', alpha=0.3, line_color='black', source=normal_and_patho_curves, color='lightsteelblue')

p_normal.text(27, y=dodge('text', 0.8, range=p_normal.y_range), text='text', source=ColumnDataSource(data=dict(text=scored_variables[1:])), **text_props)

p_normal.add_layout(BoxAnnotation(top=['Lacunes'))

BoxAnnotation expects a single coordinate (most annotation aren't vectorized). It should work when you drop the list.

Mateusz

ValueError: expected an element of either Auto or NumberSpec(String, Dict(Enum('expr', 'field', 'value', 'transform'), Either(String, Instance(Transform), Instance(Expression), Float)), Float), got ['Lacunes']

Thanks!!

--
You received this message because you are subscribed to the Google Groups "Bokeh Discussion - Public" group.
To unsubscribe from this group and stop receiving emails from it, send an email to bokeh+un...@continuum.io.
To post to this group, send email to bo...@continuum.io.
To view this discussion on the web visit https://groups.google.com/a/continuum.io/d/msgid/bokeh/e554fb73-bd4e-43d8-b4bb-4f6a53c83325%40continuum.io\.
For more options, visit https://groups.google.com/a/continuum.io/d/optout\.

--
You received this message because you are subscribed to the Google Groups "Bokeh Discussion - Public" group.
To unsubscribe from this group and stop receiving emails from it, send an email to bokeh+unsubscribe@continuum.io.
To post to this group, send email to bokeh@continuum.io.
To view this discussion on the web visit https://groups.google.com/a/continuum.io/d/msgid/bokeh/64a4805f-bc48-4b7d-909e-3524bd552dfd%40continuum.io\.
For more options, visit https://groups.google.com/a/continuum.io/d/optout\.

⌁   Link to post
Till
Till

Thanks for your reply.

I’ve opened an issue on github:

https://github.com/bokeh/bokeh/issues/8482

···

On Tue, Nov 27, 2018 at 2:30 AM Bryan Van de ven bryan@bokeh.org wrote:

I believe BoxAnnotation will require work to be able to understand categorical coordinates. A GitHub issue would be reasonable, but please make sure to include a complete minimal example script/test case that demonstrates things failing.

Otherwise the default “synthetic” width of each category is “1” so you could use that knowledge to refine the placement using numerical coordinates.

Thanks,

Bryan

On Nov 22, 2018, at 09:00, tschellhorn@gmail.com wrote:

Thanks!

I still get this error:

Javascript Error: Number property ‘top’ given invalid value: “Lacunes”

When I pass a simple string and not a list.

Do I miss anything?

On Thursday, November 22, 2018 at 3:16:31 PM UTC+1, mateusz.paprocki wrote:

Hi,

On Thu, Nov 22, 2018 at 1:33 PM landge tsche...@gmail.com wrote:

Hi,

I would like to place a BoxAnnotation on a figure with a categorical axis,

but can’t figure out how to specify the exact location on the axis.

Any help is very much appreciated.

The BoxAnnotation in the picture was placed with help of a numerical axis location.

p_normal = figure(y_range=scales, x_range=[25,110], plot_width=w, plot_height=h, toolbar_location=None, title=‘Normal’)

for scoring_variable in scored_variables[1:]:

normal_and_patho_curves = make_ridge(scoring_variable, source_data, x)
p_normal.patch('x', 'y_normal', alpha=0.3, line_color='black', source=normal_and_patho_curves, color='lightsteelblue')

p_normal.text(27, y=dodge(‘text’, 0.8, range=p_normal.y_range), text=‘text’, source=ColumnDataSource(data=dict(text=scored_variables[1:])), **text_props)

p_normal.add_layout(BoxAnnotation(top=[‘Lacunes’))

BoxAnnotation expects a single coordinate (most annotation aren’t vectorized). It should work when you drop the list.

Mateusz

ValueError: expected an element of either Auto or NumberSpec(String, Dict(Enum(‘expr’, ‘field’, ‘value’, ‘transform’), Either(String, Instance(Transform), Instance(Expression), Float)), Float), got [‘Lacunes’]

Thanks!!

–

You received this message because you are subscribed to the Google Groups “Bokeh Discussion - Public” group.

To unsubscribe from this group and stop receiving emails from it, send an email to bokeh+un...@continuum.io.

To post to this group, send email to bo...@continuum.io.

To view this discussion on the web visit https://groups.google.com/a/continuum.io/d/msgid/bokeh/e554fb73-bd4e-43d8-b4bb-4f6a53c83325%40continuum.io.

For more options, visit https://groups.google.com/a/continuum.io/d/optout.

–

You received this message because you are subscribed to the Google Groups “Bokeh Discussion - Public” group.

To unsubscribe from this group and stop receiving emails from it, send an email to bokeh+unsubscribe@continuum.io.

To post to this group, send email to bokeh@continuum.io.

To view this discussion on the web visit https://groups.google.com/a/continuum.io/d/msgid/bokeh/64a4805f-bc48-4b7d-909e-3524bd552dfd%40continuum.io.

For more options, visit https://groups.google.com/a/continuum.io/d/optout.

–

You received this message because you are subscribed to a topic in the Google Groups “Bokeh Discussion - Public” group.

To unsubscribe from this topic, visit https://groups.google.com/a/continuum.io/d/topic/bokeh/sbz8Xmb-qak/unsubscribe.

To unsubscribe from this group and all its topics, send an email to bokeh+unsubscribe@continuum.io.

To post to this group, send email to bokeh@continuum.io.

To view this discussion on the web visit https://groups.google.com/a/continuum.io/d/msgid/bokeh/77CFC941-AE36-423A-9B38-CFBB2E517259%40anaconda.com.

For more options, visit https://groups.google.com/a/continuum.io/d/optout.

⌁   Link to post

End of archived discussion · Replies are disabled