☰Read-only archive⌕
Looking for help with Bokeh?

This is a read-only archive. Ask questions and join the conversation on GitHub.

Visit Community Support on GitHub →
Archived discussions · Captured October 28, 2026

Stacked bar chart using pandas DataFrame and vbar in Bokeh plot

Community Support
Royalblue
Royalblue

Hi everyone,

I am looking for bokeh version (using vbar) of the following plot in matplotlib:

import pandas as pd
%matplotlib inline

data = [
    ['201720', 'cat1', 20],
    ['201720', 'cat2', 30],
    ['201720', 'cat3', 40],
    ['201721', 'cat1', 20],
    ['201721', 'cat2', 0],
    ['201721', 'cat3', 40],
    ['201722', 'cat1', 50],
    ['201722', 'cat2', 60],
    ['201722', 'cat3', 10],
]

df = pd.DataFrame(data, columns=['week', 'category', 'count'])

pt = df.pivot('week', 'category', 'count')

pt.plot(kind='bar', stacked=True)
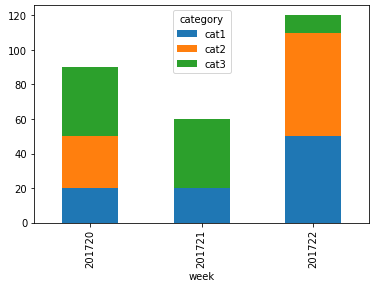
I seemed to find some related posts/answers after googling half day but still I have no idea how I can do that.


⌁   Link to post
Royalblue
Royalblue

I think the following code is the best I can do as of now:


from bokeh.plotting import figure, output_file, show

from bokeh.models import ColumnDataSource

from bokeh.models.ranges import FactorRange

import pandas as pd

data = [

['201720', 'cat1', 20],

['201720', 'cat2', 30],

['201720', 'cat3', 40],

['201721', 'cat1', 20],

['201721', 'cat2', 0],

['201721', 'cat3', 40],

['201722', 'cat1', 50],

['201722', 'cat2', 60],

['201722', 'cat3', 10],

]

df = pd.DataFrame(data, columns=['week', 'category', 'count'])

pt = df.pivot('week', 'category', 'count')

pt = pt.cumsum(axis=1)

output_file("lines.html", title='Dashboard')

p = figure(title="count",

x_axis_label='week', y_axis_label='category',

x_range = FactorRange(factors=list(pt.index)),

plot_height=300, plot_width=500)

p.vbar(x=pt.index, bottom=0, top=pt.cat1, width=0.2, color='red', legend='cat1')

p.vbar(x=pt.index, bottom=pt.cat1, top=pt.cat2, width=0.2, color='blue', legend='cat2')

p.vbar(x=pt.index, bottom=pt.cat2, top=pt.cat3, width=0.2, color='green', legend='cat3')

show(p)

The resulting plot looks like what’s expected.

What I wonder is this:

Including vbar(), Bokeh plotting methods do not seem to support ‘vectorized input’ or maybe I am missing something. Is this really the simplest(most efficient) way?

⌁   Link to post
Bryan
Bryan

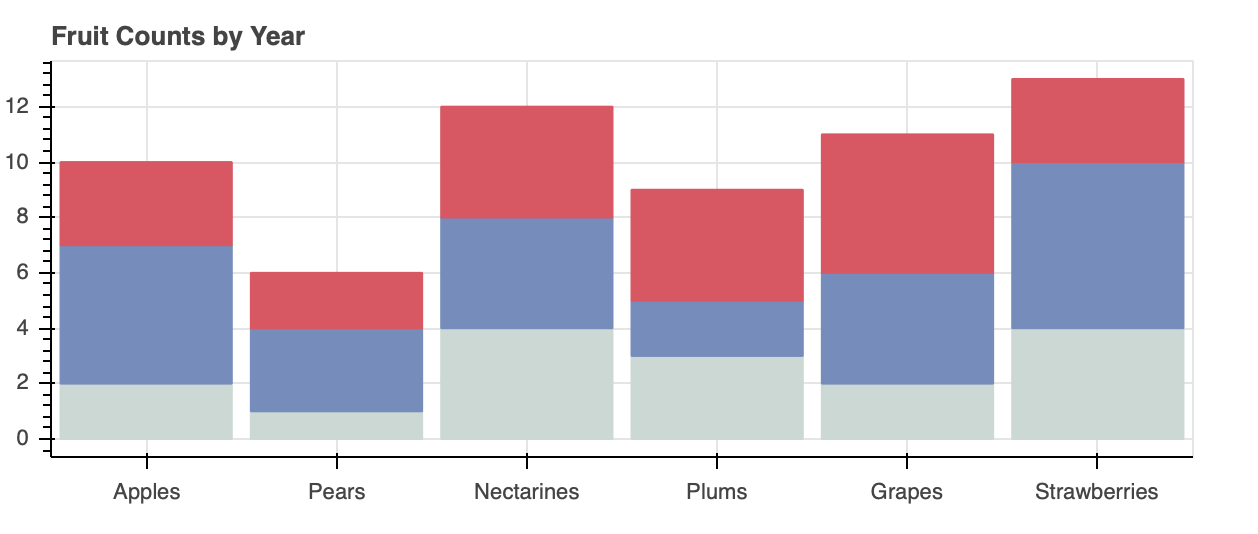
The documentation was updated some time ago with an entire section on stacked charts:

Handling categorical data — Bokeh 2.4.2 Documentation

E.g. here is a very simplified version:

from bokeh.io import show
from bokeh.plotting import figure

fruits = ['Apples', 'Pears', 'Nectarines', 'Plums', 'Grapes', 'Strawberries']
years = ["2015", "2016", "2017"]
colors = ["#c9d9d3", "#718dbf", "#e84d60"]

data = {'fruits' : fruits,
        '2015'   : [2, 1, 4, 3, 2, 4],
        '2016'   : [5, 3, 4, 2, 4, 6],
        '2017'   : [3, 2, 4, 4, 5, 3]}

p = figure(x_range=fruits, plot_height=250, title="Fruit Counts by Year",
           toolbar_location=None, tools="")

p.vbar_stack(years, x='fruits', width=0.9, color=colors, source=data)
show(p)

⌁   Link to post

End of archived discussion · Replies are disabled