

☰Read-only archive⌕
Looking for help with Bokeh?

This is a read-only archive. Ask questions and join the conversation on GitHub.

Visit Community Support on GitHub →
Archived discussions · Captured October 28, 2026

Streamlit Bokeh doesn´t load data in plot

Community Supportbokeh
Joao_Barbosa
Joao_Barbosa

I have this code but simply nothing appears on the chart, if you can help me I would appreciate it

`

import streamlit as st
from bokeh.plotting import figure
from bokeh.models import ColumnDataSource
import pandas as pd

data = pd.read_csv("SERIE.CSV", names=["gx", "gy", "gz", "ax", "ay", "az", "roll", "pitch", "yaw", "time_stamp", "FLAG_VIDEO", "TAG"])

source = ColumnDataSource(data)
fig = figure(title="My Plot", x_axis_label="X Axis", y_axis_label="Y Axis")

fig.line(x="time_stamp", y="ax", source=source)

start = st.slider("Start", min_value=0, max_value=len(data)-1, value=0)
end = st.slider("End", min_value=0, max_value=len(data)-1, value=len(data)-1)

new_data = data.iloc[start:end+1]
source.data = ColumnDataSource.from_df(new_data)

st.bokeh_chart(fig)

`
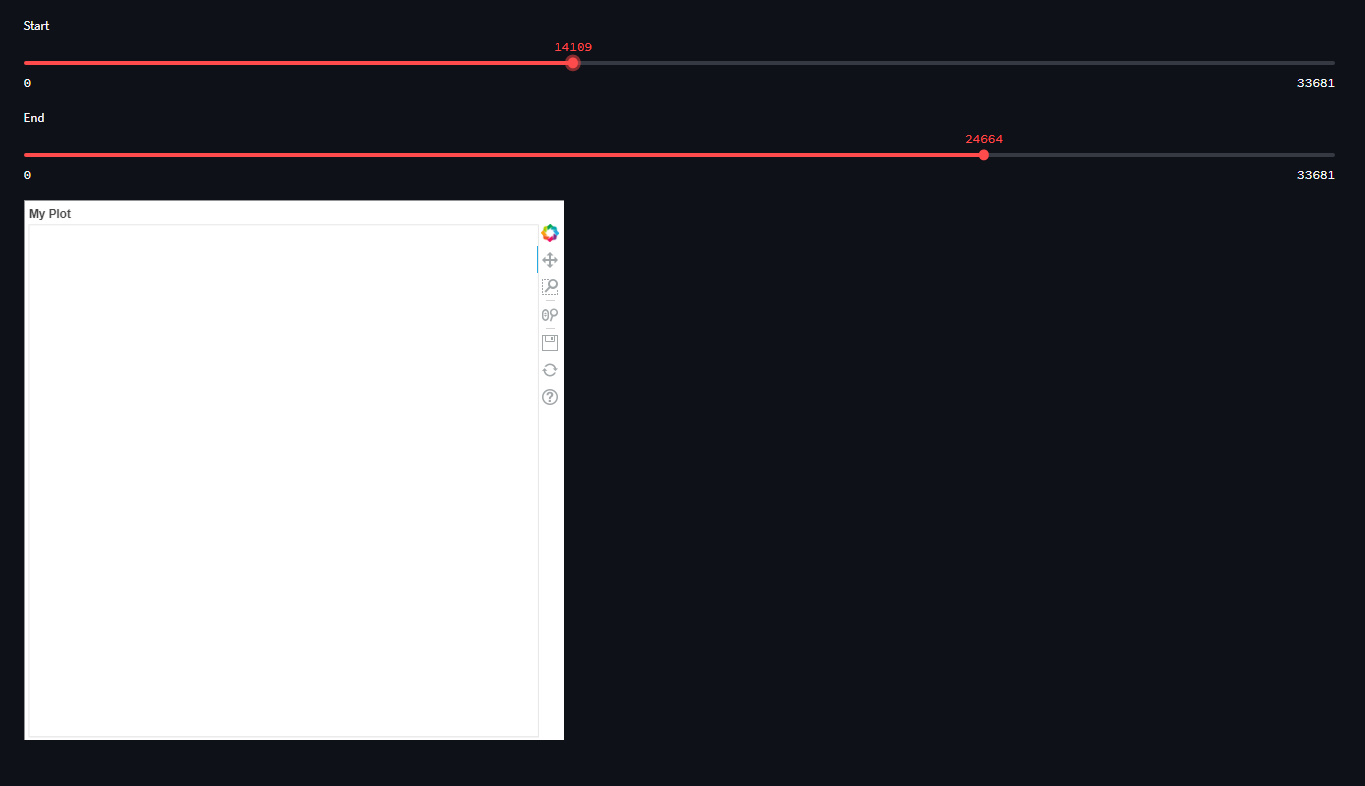
⌁   Link to post
Bryan
Bryan

Are there any errors reported in the browser JS console? Does this code work outside streamlit? Is the x-axis supposed to be a datetime axis? Does the timestamp column actually contain datetime values? My best guess without more information is that you have not actually parsed the timestamp column as datetime values, and also have not set the axis type to be datetime.

⌁   Link to post

End of archived discussion · Replies are disabled

