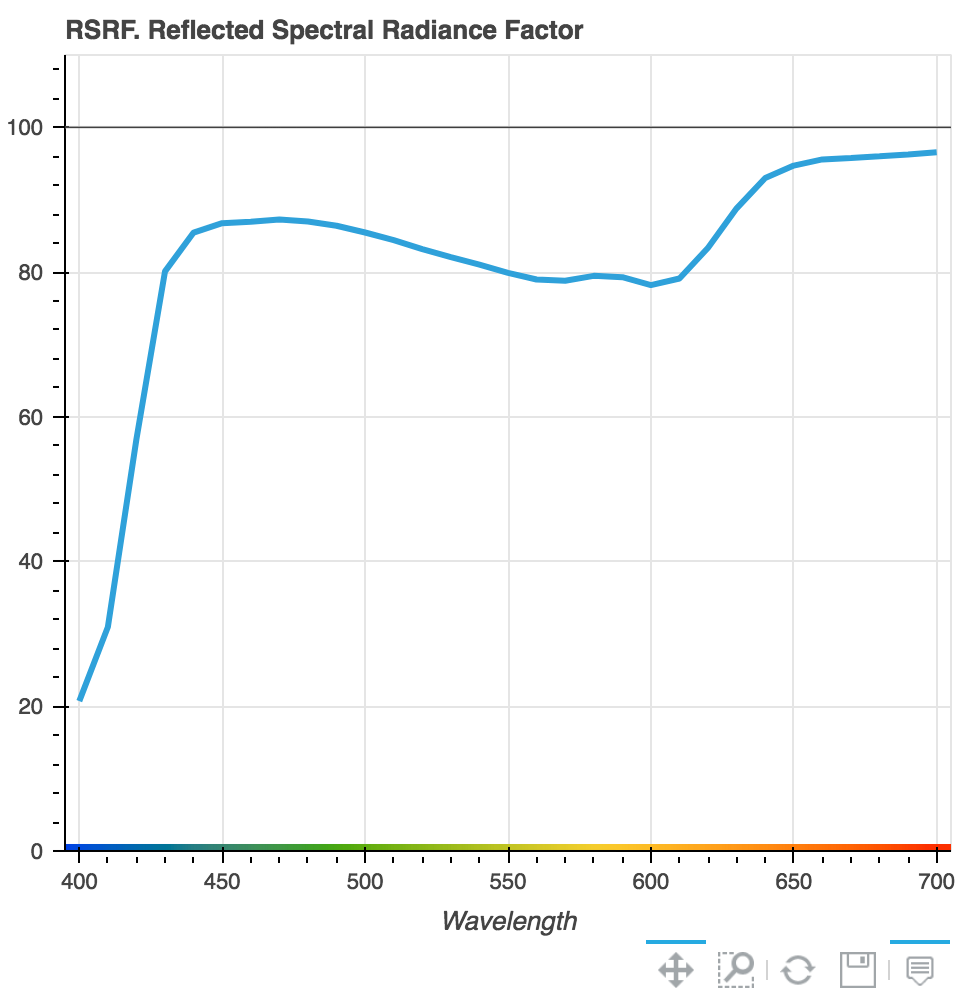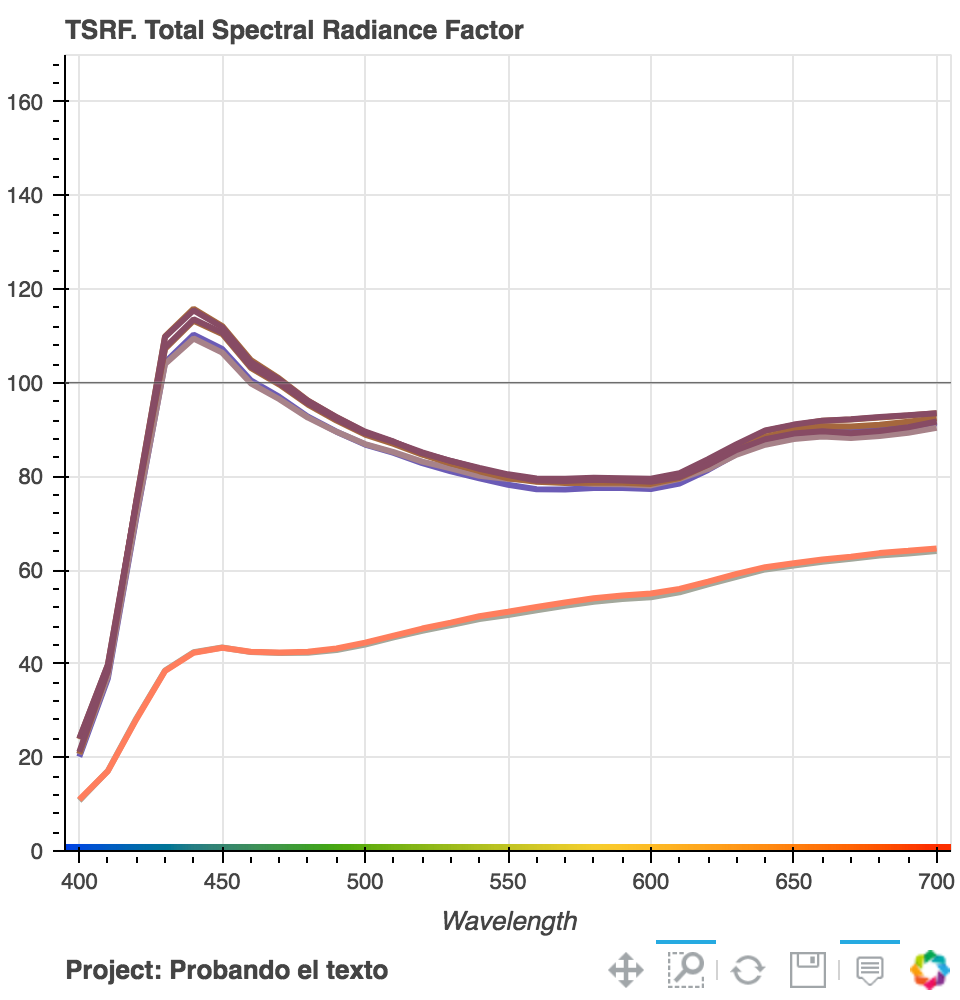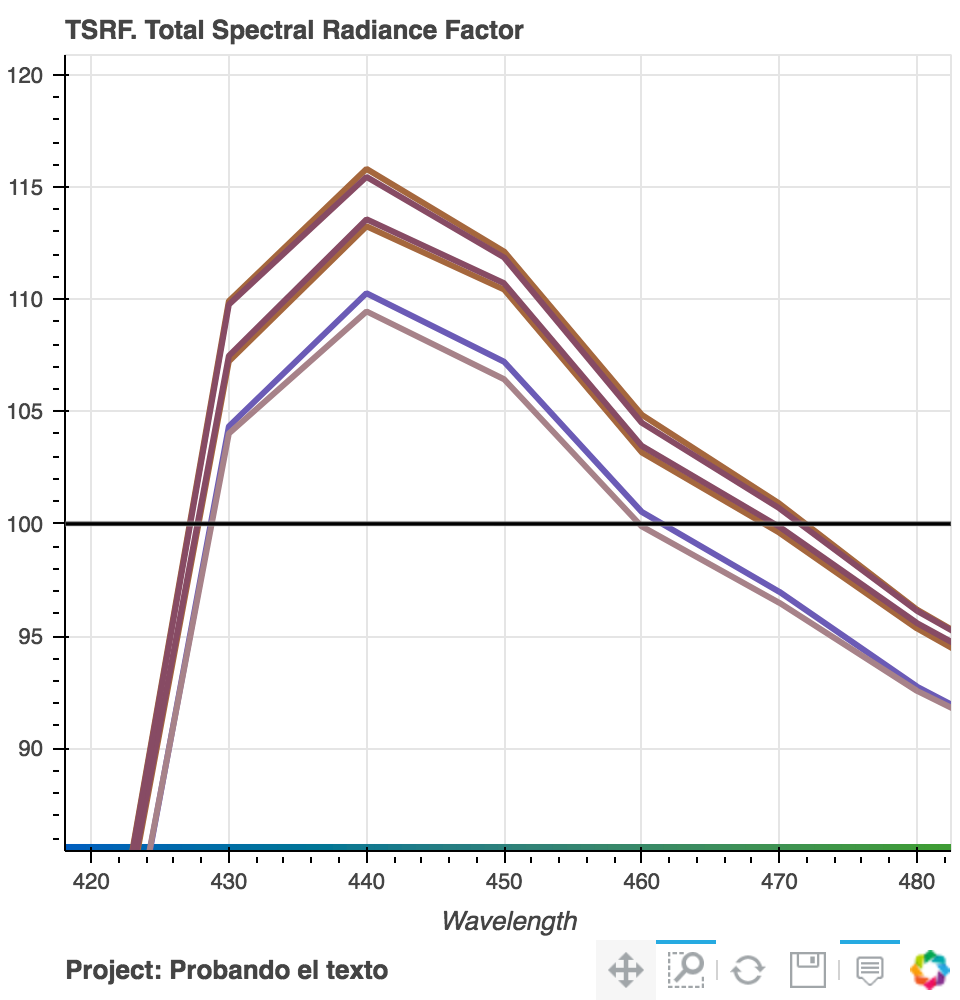
Dear Community,
Concerning styling axes, is it possible to use some palette on axis_line_color? Or just one color like “red”?
Thank you.
 Read-only archive⌕
Dear Community,
Concerning styling axes, is it possible to use some palette on axis_line_color? Or just one color like “red”?
Thank you.

@CONSUMERTEC the short answer is “no” but to be honest I am not entirely sure what behavior you are trying to be able to produce. Can you point to some example somewhere?
Thank you @Bryan. An example could be:
    # generate data
    x = list(range(395, 705, 1))
    y = 0.01
    # create linear color mapper
    mapper = linear_cmap(field_name="x", palette=list(cc.b_rainbow_bgyr_35_85_c72), low=min(x), high=max(x))
    # create dash renderer with color mapper
    plot_without.dash(x, y, size=20, alpha=1, line_width=7, color=mapper)
The problem is that the coloured line is fixed to a one specific y value. The ideal situation could be if the x axis itself contains the coloured line.
Thank you.
That’s definitely not possible with the axis. I have to be honest and say it’s a very niche use-case (no-one has asked for it in ~12 years) and it would not be trivial to add, so I would rate the chances of it being added as fairly low.
A possible option for your current situation might be to use a CustomJS on range changes to adjust the y-coordinate of the dash glyph to always be a the y-range start

Is your x axis “locked” for this use case?
If so, there is an easy but janky workaround that probably gets you pretty close. Use a colorbar, with its low and high set to the figure’s x_range, remove its padding/margin, and put it “below” with the x axis of the figure turned off:
from bokeh.plotting import figure, show
from bokeh.palettes import Turbo256
from bokeh.transform import linear_cmap, LinearColorMapper,transform
from bokeh.models import ColumnDataSource, ColorBar, Range1d
import numpy as np
# generate data
x = list(range(395, 705, 1))
y = [n+np.random.random()*10 for n in x]

f = figure(
           tools='pan'
           ,x_range=(min(x),max(x))
           )
#locking the x axis
f.tools[0].dimensions='height'

f.xaxis[0].visible=False #try with this commented out to see the idea

r = f.line(x=x,y=y)

m = LinearColorMapper(palette=Turbo256, low=min(x), high=max(x))
mapper = transform(field_name="x", transform=m)

cb = ColorBar(color_mapper=m,orientation='horizontal'
              # ,title='Wavelength' #title not going probably where you want...
              )

cb.padding=0
cb.margin = 0
f.add_layout(cb,'below')

show(f)
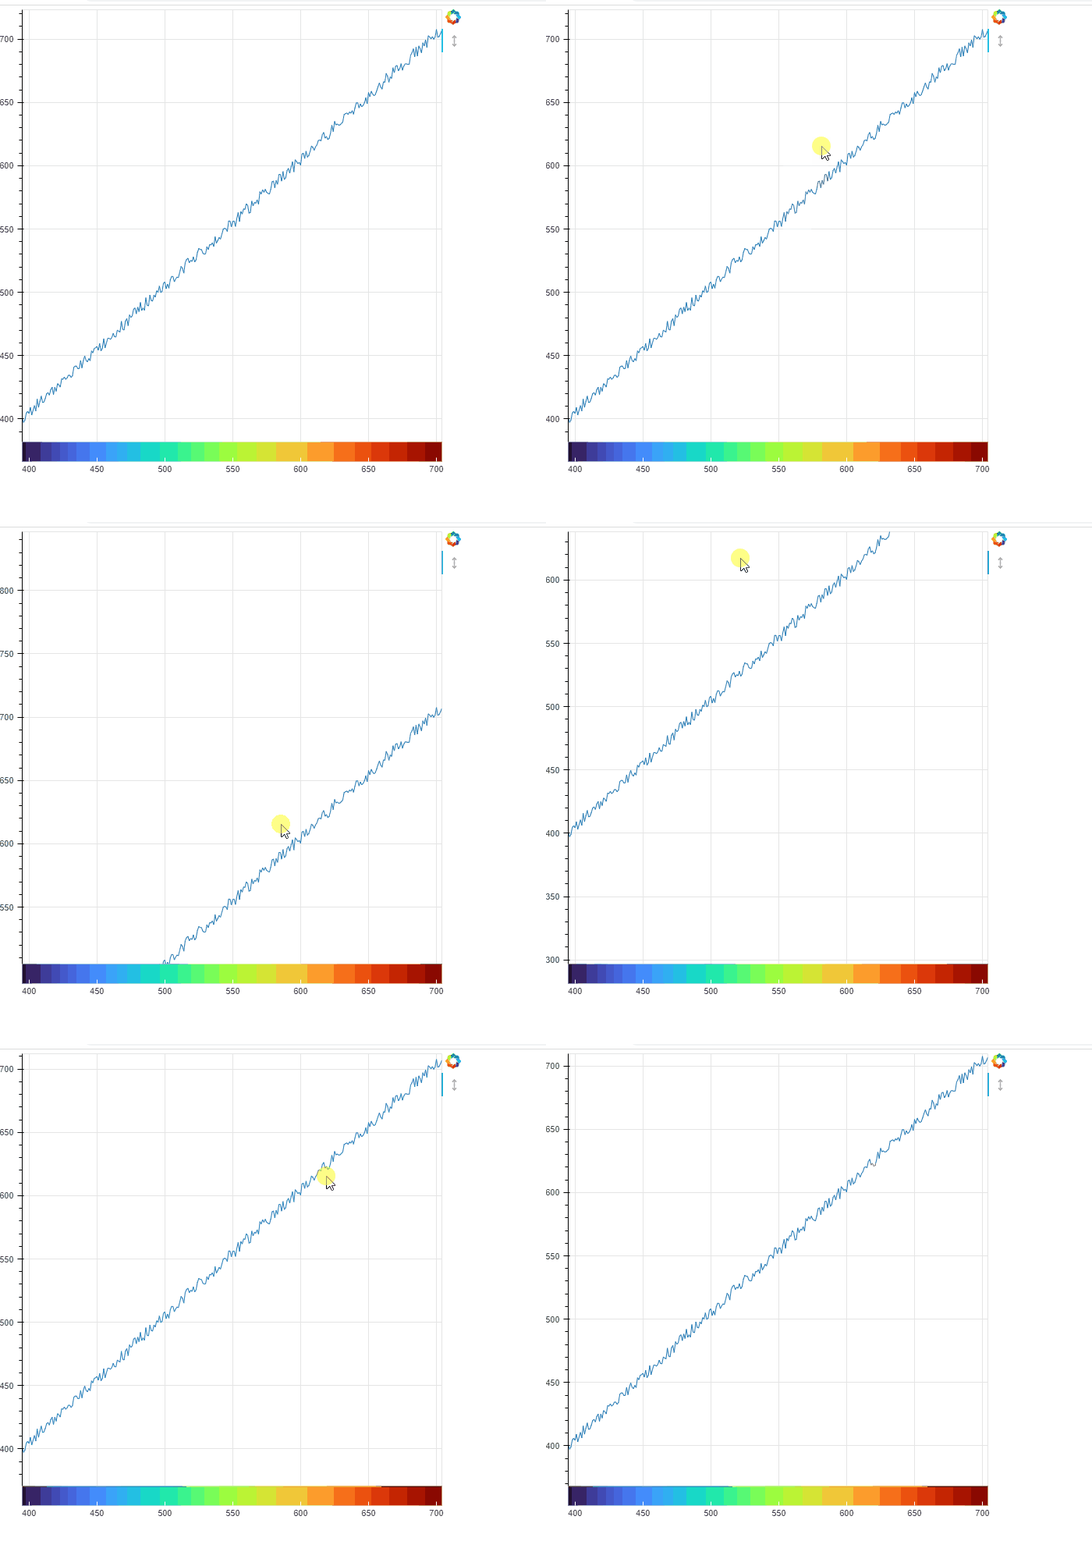
Two things:
If your x axis is dynamic (i.e. you want to be able to zoom in and out or pan left to right… you’ll need CustomJS (a la @Bryan 's suggestion) to update the low/high of the colorbar correspondingly.
I don’t like that I can’t get the ColorBar title (i.e. “Wavelength”) to show up on the bottom and in the centre, but maybe you can finagle it with a Div or something…
Thank you @Bryan @gmerritt123 for your comments. The x axis has to change dynamically with the box_zoom tool, so I have to use CustomJS. Could you please recommend me any example of it? How to access the rectangular region boundaries that define the new plot bounds? Thank you.
Actually super easy:
cjs = CustomJS(args=dict(m=m,f=f) #f = the figure, and m = LinearColorMapper
               ,code='''
               m.low = f.x_range.start
               m.high = f.x_range.end

               ''')
f.x_range.js_on_change('start', cjs)
f.x_range.js_on_change('end', cjs)
EDIT → This might not be exactly what you want because it alters what color corresponds to what value… hmmm…
That is good, thank you @gmerritt123 . Applying your example to the y axe, what it is necessary is the new start, based on that the origin for the dash glyph can change.
Dear @Bryan @gmerritt123. I reach the solution, see figures:
Before box_zoom:
After box_zoom:
The partial code is:
# generate data
source_dash_without = ColumnDataSource(data=dict(xaux=list(range(395, 705, 1)), y=[0.01] * 310))
##
## create linear color mapper
mapper = linear_cmap(field_name="xaux", palette=list(cc.b_rainbow_bgyr_35_85_c72), low=min(source_dash_without.data['xaux']), high=max(source_dash_without.data['xaux']))
##
# create dash renderer with color mapper
plot_without.dash(x="xaux", y="y", size=20, alpha=1, line_width=7, color=mapper, source=source_dash_without)
## the callback
cjs_without = CustomJS(args=dict(p=plot_without,source=source_dash_without),code='''
        var new_y = []
        for (var i=0;i<source.data['y'].length;i++){
            new_y.push(p.y_range.start)
            }
        source.data['y'] = new_y
        source.change.emit();
    ''')
plot_without.y_range.js_on_change('start', cjs_without)
##
Thank you again for your comments and examples. Rodrigo

This topic was automatically closed 90 days after the last reply. New replies are no longer allowed.
End of archived discussion · Replies are disabled