
☰Read-only archive⌕
Looking for help with Bokeh?

This is a read-only archive. Ask questions and join the conversation on GitHub.

Visit Community Support on GitHub →
Archived discussions · Captured October 28, 2026

Surface3D custom axis setup

Community Support
krowney
krowney

Hey all-
[TLDR: I don’t know how to setup the z-axis so its centered in the 3D plot]

I’ve successfully setup and run this Surface3D example in my Jupyter Lab notebook on my mac:

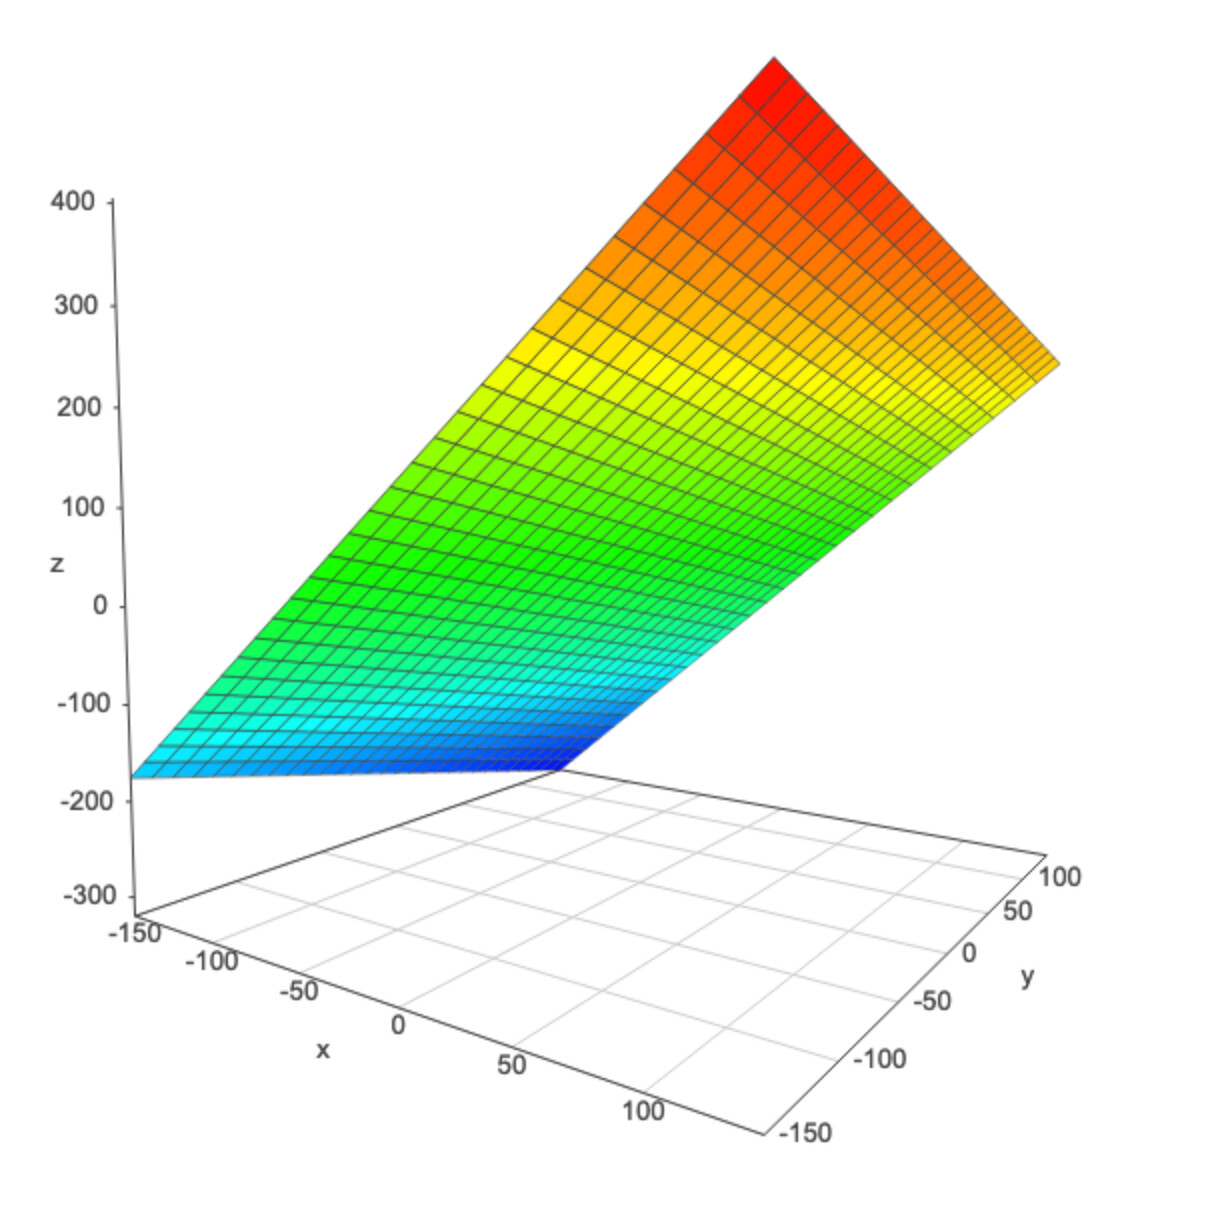
I’m looking for documentation and/or examples on how to plot a 3D object in Bokeh so that the origin is centered in the middle of the plotted area so z-axis points up, and negative values of the x and y coordinates extend in the appropriate directions away from that z-axis.

In the attached picture, you can see that i have defined a meshgrid with values that are positive and negative for x and y, but when plotted; the z-axis sprouts straight up from the x,y coordinates of (-150,-150). Trying to find a way for the plot to display the z-axis pointing up from (0,0). Would be grateful for any help you all could provide

⌁   Link to post
Bryan
Bryan

Hi @krowney it’s probably worth clarifying one point up front: Bokeh itself has no built-in or supported 3d plotting capability, at all. The “Surface3d” example is, first and foremost, and example how it is possible to wrap external, third-party tools as custom extensions that can be used with Bokeh. In this case, the external library is the Graph3d library from vis.js. So the question about what can or can’t be done here is going to be somewhere in the graph3d docs:

https://visjs.github.io/vis-graph3d/docs/graph3d/index.html

In my experience the Graph3d API is fairly limited (we used it for the example precisely because it was a simple toy API good for demonstration). But it does look like there is an xMin value you can pass in the configuration options.

⌁   Link to post

End of archived discussion · Replies are disabled
