
☰Read-only archive⌕
Looking for help with Bokeh?

This is a read-only archive. Ask questions and join the conversation on GitHub.

Visit Community Support on GitHub →
Archived discussions · Captured October 28, 2026

surface3d example color fixed to z axis values

Community Support
daniel.fudge1977
daniel.fudge1977

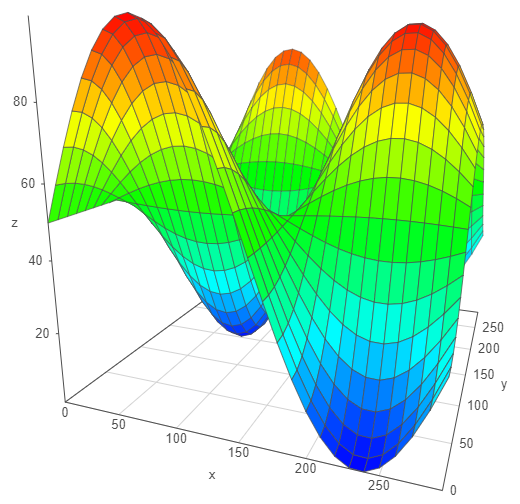
I’m trying to set the surface color to something other than the z axis values but the surface color does not change.

The example from bokeh/examples/app/surface3d at branch-3.0 · bokeh/bokeh · GitHub has the lines:

value = np.sin(xx/50) * np.cos(yy/50) * 50 + 50

``
source = ColumnDataSource(data=dict(x=xx, y=yy, z=value, color=value))

surface = Surface3d(x=“x”, y=“y”, z=“z”, color=“color”, data_source=source, width=600, height=600)

I’ve updated as follows:

value = np.sin(xx/50) * np.cos(yy/50) * 50 + 50

color = np.linspace(0, 1, value.shape[0])

source = ColumnDataSource(data=dict(x=xx, y=yy, z=value, color=color))

surface = Surface3d(x=“x”, y=“y”, z=“z”, color=“color”, data_source=source, width=600, height=600)

``

But the image remains the same as the attached png.

Version Info
···

Python version 2.7.13

Anaconda2 Distribution 4.4.0 Community Edition

Bokeh version 0.12.5

nodejs version 9.11.0

Windows 8.1 Pro (Build 9600)

Chrome Version 65.0.3325.181 (Official Build) (64-bit)

⌁   Link to post
Bryan
Bryan

Hi,

As I mentioned in surface3d example color fixed to z axis · Issue #7814 · bokeh/bokeh · GitHub this is a limitation of the underlying Graph3d library, so there is nothing to do (except remove the extraneous color property from the example altogether). This example is merely meant to be illustrative of the techniques of wrapping an external JS lib, not necessarily complete or very useful on its own.

Thanks,

Bryan

···

On Apr 19, 2018, at 12:00, daniel.fudge1977@gmail.com wrote:

I'm trying to set the surface color to something other than the z axis values but the surface color does not change.

The example from https://github.com/bokeh/bokeh/tree/master/examples/app/surface3d has the lines:
value = np.sin(xx/50) * np.cos(yy/50) * 50 + 50
source = ColumnDataSource(data=dict(x=xx, y=yy, z=value, color=value))
surface = Surface3d(x="x", y="y", z="z", color="color", data_source=source, width=600, height=600)

I've updated as follows:
value = np.sin(xx/50) * np.cos(yy/50) * 50 + 50
color = np.linspace(0, 1, value.shape[0])
source = ColumnDataSource(data=dict(x=xx, y=yy, z=value, color=color))
surface = Surface3d(x="x", y="y", z="z", color="color", data_source=source, width=600, height=600)

But the image remains the same as the attached png.

Version Info
----------------------------------------------------------------------------------------
Python version 2.7.13
Anaconda2 Distribution 4.4.0 Community Edition
Bokeh version 0.12.5
nodejs version 9.11.0
Windows 8.1 Pro (Build 9600)
Chrome Version 65.0.3325.181 (Official Build) (64-bit)


--
You received this message because you are subscribed to the Google Groups "Bokeh Discussion - Public" group.
To unsubscribe from this group and stop receiving emails from it, send an email to bokeh+unsubscribe@continuum.io.
To post to this group, send email to bokeh@continuum.io.
To view this discussion on the web visit https://groups.google.com/a/continuum.io/d/msgid/bokeh/673729e6-6765-4d1d-b917-9b70f4e2fb6a%40continuum.io\.
For more options, visit https://groups.google.com/a/continuum.io/d/optout\.
<surface3d.png>

⌁   Link to post

End of archived discussion · Replies are disabled