On Mar 14, 2016, at 7:53 PM, Erwin Kalvelagen <erwin.kalvelagen@gmail.com> wrote:
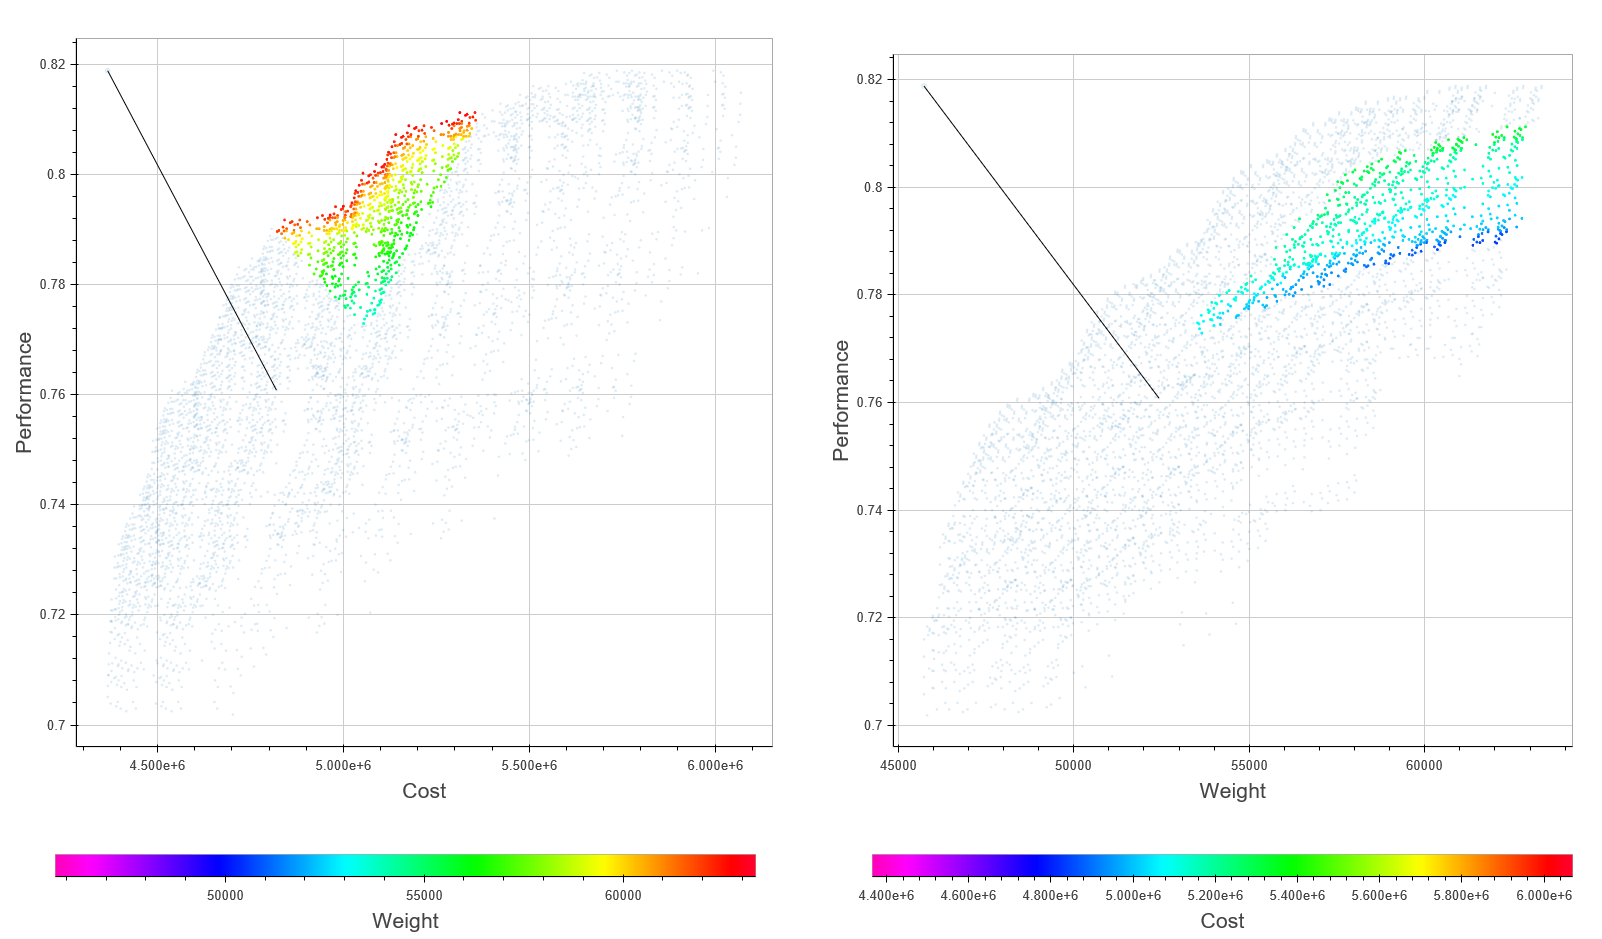
Below is an example of a selection in the two linked plots. Basically I would like the same behavior but now for tooltips when hovering.
On Monday, March 14, 2016 at 2:00:08 PM UTC-4, Erwin Kalvelagen wrote:
Yes it is the same single dataset. Basically a single 3D data set (performance, weight, cost) that we look at in two different ways. So yes we want to same data point (i.e. same ID) to be "tooltipped" (if that is the right expression). They will be in different locations (in the other plot the data point could even not be visible -- I have not thought through that special case, I guess for now do whatever is easiest, e.g. ignore). The box and lasso selection are already linked (that is very useful!) and also panning/zooming wrt to the performance axis (that is the axis they share) is correctly synchronized: very cool!
Thanks! Erwin
On Monday, March 14, 2016 at 1:27:19 PM UTC-4, Bryan Van de ven wrote:
Hi Erwin,
Something might be currently possible with CustomJS callbacks, but more information about what you want is needed, because there are a few possibilities. Do the two plots have data sets that are the same size (or possibly even share a data source?) If so, is what you want for the point with the corresponding index to get a tooltip? E.g., if point 137 on the left has a tooltip, you want point 137 on the right to get one? Alternatively, do you want the x,y data coordinates to trigger a new, separate "hit test" on the right plot, using those same data coordinates? (for instance if the data are not the same size/same data source this is all you could expect to be able to do)
Bryan
> On Mar 14, 2016, at 10:41 AM, Erwin Kalvelagen <erwin.ka...@gmail.com> wrote:
>
> Good morning:
>
>
>
>
>
> I have two linked plots. When hovering, I would like to have a tooltip appear in both plots.
>
>
>
> I already use the linked selection (box and lasso) with great success, but now I want to link the tooltips also.
>
>
>
> Below is an example. The tooltip appears in the left plot. It would be great if I can have the corresponding tooltip appear in the right plot.
>
>
>
> Thanks, Erwin
>
>
>
>
>
>
>
>
> --
> You received this message because you are subscribed to the Google Groups "Bokeh Discussion - Public" group.
> To unsubscribe from this group and stop receiving emails from it, send an email to bokeh+un...@continuum.io.
> To post to this group, send email to bo...@continuum.io.
> To view this discussion on the web visit https://groups.google.com/a/continuum.io/d/msgid/bokeh/a7912860-7f64-45ba-96d6-18310f6b4740%40continuum.io\.
> For more options, visit https://groups.google.com/a/continuum.io/d/optout\.
--
You received this message because you are subscribed to the Google Groups "Bokeh Discussion - Public" group.
To unsubscribe from this group and stop receiving emails from it, send an email to bokeh+unsubscribe@continuum.io.
To post to this group, send email to bokeh@continuum.io.
To view this discussion on the web visit https://groups.google.com/a/continuum.io/d/msgid/bokeh/b56426b4-85fd-4bbf-9dad-f03952b273c2%40continuum.io\.
For more options, visit https://groups.google.com/a/continuum.io/d/optout\.